The strategic use of TS Inter 1st Year Economics Model Papers Set 3 allows students to focus on weaker areas for improvement.
TS Inter 1st Year Economics Model Paper Set 3 with Solutions
Time: 3 Hours
Maximum Marks: 100
Section – A
Note : Answer ANY THREE out of the following five questions in not exceeding 40 lines each. (3 × 10 = 30 )
Question 1.
Illustrate the consumer’s equilibrium using indifference curve analysis.
Answer:
A consumer is said to be in equilibrium with given his tastes, prices of the two goods and income on the purchase of two goods in such a way so as to get the maximum satisfaction :
I. Assumptions : The analysis of consumer’s equilibrium is based on the following assumptions :
- Consumer has an indifference map showing his scale of preferences which remains the same throughout the analysis.
- Money income is given and constant.
- Prices of the two goods are given and constant.
- The consumer is rational and thus maximizes his satis-faction.
- There is no change in tastes, preferences and habits of the consumer.
- There is a perfect competition in the goods market.
II. Conditions of Equilibrium : There are two conditions that must be satisfied for the consumer to be in equilibrium. These are:
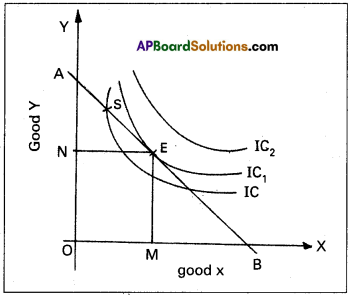
i) At the point of equilibrium, the budget / price line must be tangent to the indifference curve at its minimum point, ii) At the point of equilibrium, the consumer’s MRSxy and the price ratio must be equal, i.e. MRSxY = Px/PY. This can be shown in the following diagram.
In the diagram ‘AB’ is consumer’s budget or price line. IC, IC1, IC2 are indifference curves. In the diagram the consumer is equilibrium at OM of x and ON of y. At point E the price line touches to ‘O’ IC1 At point ‘S’ consumer will be on lower indifference curve IC and will be an get¬ting lesser satisfaction than at E on IC. IC2 is beyond the capacity of consumer. So it is outside to the budget line.
![]()
Question 2.
Critically examine the law of variable proportions.
Answer:
The law of variable proportions has been developed by the 19th century economists David Ricardo and Marshall. The law is associated with the names of these two economists. The law states that by increasing one variable factor and keeping other factors constant, how to change the level of output, total output first increases at increasing rate, then at a diminishing rate and later decreases. Hence, this law is also known as the “Law of Diminishing returns”. Marshall stated it in the following words.
“An increase in capital and labour applied in the cultiva-tion of land causes in general less than proportionate in-crease in the amount of produce raised, unless it happens to coincide with an improvement in the arts of agriculture”. Assumptions:
- The state of technology remain constant.
- The analysis relates to short period.
- The law assumes labour in homogeneous.
- Input prices remain unchanged.
Explanation of the Law:
Suppose a farmer has ‘4’ acres of land he wants to increase output by increasing the number of labourers, keeping other factors constant. The changes in total production, average product and marginal product can be observed in the following table.
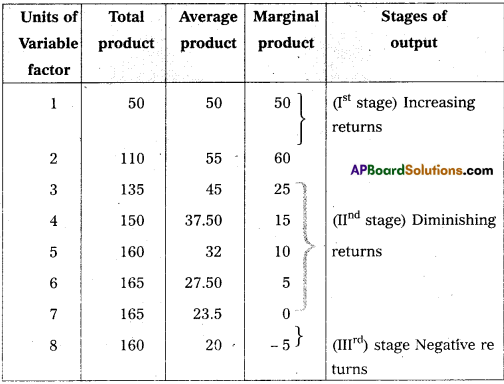
In the above table total product refers to the total output produced per unit of time by all the labourers employed. Average product refers to the product per unit of labour marginal product refers to additional product obtained by employing an additional labour.
In the above table there are three stages of production :
1st stage i.e., increasing returns at 2 units total output increases average product increases and marginal product reaches maximum.
2nd stage i.e., diminishing returns from 3rd unit onwards TP increases at diminishing rate and reaches maximum, MP becomes zero and AP continuously decreases.
3dr stage i.e., negative returns from 8th unit TF* decreases AP declines and MP becomes negative.
This can be explained in the following diagram.
In the diagram, on ‘OX’ axis shown units labourer and OY axis show TP, MP and A.P. 1st stage TP, AP increases and MP is maximum. In the 2nd stage TP is maximum, AP decreases and MP is zero. At 3rd stage TP declines, AP also declines, MP becomes negative.
Question 3.
What is monopoly ? Explain how price is determined under monopoly.
Answer:
Monopoly is one of the market in the imperfect competition. The word Mono’ means ‘single’ and ‘Poly’ means ‘seller’. Thus, monopoly means single seller market. In the words of Bilas, “Monopoly is represented by a market situation in which there is a single seller of a product for which there are no close substitutes, this single seller is unaffected by and does not affect, the prices and outputs ofother products sold in the economy”.
- Monopoly exists under the following conditions :
- There is a single seller of product.
- There are no close substitutes.
- Strong barriers to entry into the industry exist.
- Features of Monopoly :
- There is no single seller in the market.
- No close substitutes.
- There is no difference between firm and industry.
- The monopolist either fix the price or output.
Price Determination”:
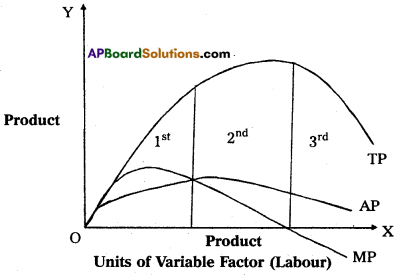
Under monopoly, the monopolist has complete control over the supply of the product. He is price maker who can set the price to attain maximum profit. But he cannot do both things simultaneously. Either he can fix the price and leave the output to be determined by consumer demand at a particular price. Or he can fix the output to be produced and leave the price to be determined by the consumer demand for his product. This can be shown in the diagram.
In the above diagram, on ‘OX’ axis measures output and ‘OY axis measures cost. AR is Average Revenue curve, AC is Average Cost curve. In the above diagram, at point E where MC = MR at that point the monopolist determines the out-put. Price is determined where this output line touches the AR line. In the above diagram for producing OQ quantity cost of production is OCBQ and revenue is OPAQ.
Profit = Revenue – Cost
= PACB shaded area is profit under monopoly.
![]()
Question 4.
Explain critically the marginal productivity theory of distri-bution.
Answer:
This theory was developed by J.B.Clark. According to this theory, the remuneration of a factor of production will be equal to its marginal productivity. The theory assumes perfect competition in the market for factors of production. In such a market, average cost and marginal cost of each unit of factor of production Eire the same as they are equal to the price or cost of a factor of production.
For example, if four tailors can stitch ten shirts in a day and five tailors can stitch thirteen shirts in a day, then the marginal physical product of the 5th tailor is 3 shirts. If stitching charge for a shirt is ₹ 100/-, then the marginal value product of three shirts is ₹ 300/-. According to this theory, the 5th person will be remunerated ₹ 300/-. Marginal physical product is the additional output obtained by using an additional unit of the factor of production. If we multiply the additional output by market price we will get marginal value product or marginal revenue product.
At first stage when additional units of labour are employed the marginal productivity of labourer increases up to certain extent due to economies of scale. If additional units of labour are employed beyond that point the marginal productivity of labour decreases. This can be shown in the given figure. In the figure, OX axis repre-sent units of labour and OY represent price/revenue/cost. At a given price,
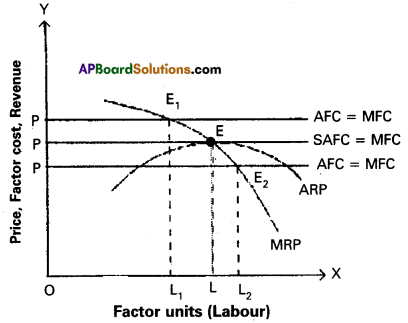
OP the firm will employ OL units of labour where price OP = L. If it employs less than ‘OL! i.e., OL1 units, MRP will be E1L1, which is higher than the price OP If firm employs more than OL units upto OL2, price is OP is more than E2L2. So the firm decreases employment until price = MRP till OL. At that point ‘E’ the additional unit of labour is remunerated equal to his marginal productivity.
Question 5.
Critically examine the classical theory of employment.
Answer:
The theory of output and employment developed by economists such as Adam Smith, David Ricardo, Malthus is known as classical theory. It is based on the famous “Law of markets” advocated by J.B. Say. According to this law “supply creates its own demand”. The classical theory of employment assumes that there is always full employment of labour and other resources. The classical economists ruled out any general unemployment in the long run. These views are known as the classical theory of output and employment.
The classical theory of employment can be three dimensions.
A. Goods market equilibrium
B. Money market equilibrium
C. Equilibrium of the labour market (Pigou wage cut policy).
A) Goods market equilibrium:
The 1st part of Say’s law of markets explains the goods market equilibrium. According to Say “supply creates its own demand”. Say’s law states that supply always equals demand. Whenever additional output is produced in the economy, the factors of production which participate in the process of production. The total income generated is equivalent to the total value of the output produced. Such income creates additional demand for the sale of the additional output. Thus there could be no deficiency in the aggregate demand in the economy for the total output. Here every thing is automatically adjusting without need of government intervention.
The classical economists believe that economy attains equilibrium in the long run at the level of full employment. Any disequilibrium between aggregate demand and aggregate supply equilibrium adjusted automatically. This changes in the general price level is known as price flexibility.
B) Money market equilibrium:
The goods market equili-brium leads to bring equilibrium of both money and labour markets. In goods market, it is assumed that total income spent the classical economists agree that part of the income may be saved. But the savings is gradually spent on capital goods. The expenditure on capital goods is called investment. It is assumed that equality between savings and investment is brought by the flexible rate of interest. This can be explained by the following diagram.
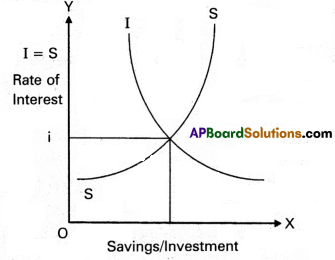
In the diagram savings and investment are measured on the ‘X’ axis and rate of interest on ‘Y’ axis. Savings and investments are equal at ‘Oi’ rate of interest. So money market equilibrium can be automatically brought through the rate of interest flexibility.
C) Labour market equilibrium :
According to the classical economists, unemployment may occur in the short run. This is not because the demand is not sufficient but due to increase in the wages forced by the trade unions. A.C. Pigou suggests that reduction in the wages will remove unemployment. This is called wage – cut policy. A reduction in the wage rate results in the increase in employment.
According to the classical theory supply of and demand for labour are determined by real wage rate. Demand for labour is the inverse function of the real wage rate. The supply of labour is the direct function of real wage rate. At a particular point real wage rate the supply of and the demand for labour in the economy become equal and thus equili-brium attained in the labour market. Thus there is full employment of labour. This can be explained with the help of diagram.
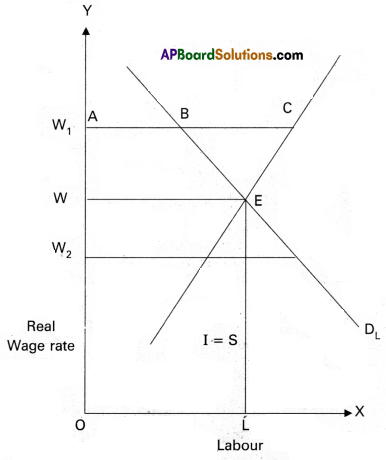
In the above diagram supply of and demand for labour is measured on the X – axis. The real wage rate is measured on the Y axis. If the wage rate is OWp the supply of labour more than the demand for labour. Hence the wage rate falls. If the real wage rate is OW2 the demand for labour is more than supply of labour. Hence the wage rate rises. At OW, real wage rate the supply and demand are equal. This is equilibrium.
Assumptions:
1. There is no interference of government of the economy.
2. Perfect competition in commodity and labour market.
3. Full employment.
Section – B
Question 6.
Analyze the characteristics of wants.
Answer:
Human wants are starting point of all economic activities. They depend on social and economic conditions of individu-als. Characteristic features of wants :
- Unlimited wants: Human wants are unlimited. There is no end to human wants. When one want is satisfied an-other want takes its place. Wants differ from person to person, time to time and place to place.
- A Particular Want is Satiable: Although a man cannnot satisfy all his wants, a particular want can be satisfied completely in a period of time. Ex : If a person is thirsty he can satisfy it by drinking a glass of water.
- Competition: Human wants are unlimited. But the means to satisfy them are limited of scarce. Therefore, they complete with each other in priority of satisfaction.
- Complementary: To satisfy a particular want we need a group of commodities at the same time. Ex: Writing need is satisfied only when we have pen, ink and paper together.
- Substitution: Most of our wants can be satisfied by dif-ferent ways. Ex: If we feel hungry, we can eat rice or fruits satisfy this want.
- Recurring: Many wants appear again and again though they are satisfied at one point of time.
- Habits: Wants change into habits, which cannnot be given up easily. Ex: Smoking cigarettes for joke results into a habit if it is not controlled.
- Wants vary with time, place and person : Wants go on changing with the passage of time. They are changing from time to time, place to place and person to person. Human wants are divided into 1. Necessities, 2. Comforts and 3. Luxuries.
Question 7.
Explain the concept of utility analysis. What are its short comings?
Answer:
The concept of utility was introduced in economic thought by Jevans in 1871. In a general sense, utility is the ‘want sat-isfying power’ of a commodity or service. In economic sense, utility is a psychological phenomenon. It is a feeling of satis-faction, a consumer derives from the consumption of a com-modity. Utility has nothing to do with usefulness. Utility and usefulness are different. A commodity may satisfy a human want but it may not be useful. For example, wine is harmful to health but satisfies the want of a drunkard. Whether the good is useful or not, if it satisfies a human want we can say that it possesses utility.
Utility is a subjective concept. It differs from person to person, from time to time and place to place. As regards to the measurement of utility, there are two different approaches :
1. Cardinal utility and
2. Ordinal utility. Let us introduce then in brief.
Shortcomings of Utility Analysis: The following are the main defects pointed out on utility analysis.
- Cardinal measurement is not possible.
- Assumption of rational consumer is not correct.
- Wrong assumption of independent utilities. Utility of a good depends on other goods also.
- Assumption of constant marginal utility of money is wrong.
- One commodity model is unrealistic.
- Income effect, price effect and substitution effect are not clearly brought out.
- This analysis fails to explain the demand for indivisible goods.
![]()
Question 8.
Explain the Law of Demand.
Answer:
Demand means a desire which is backed up by ability to buy and willingness to pay the price is called demand in Eco-nomics. Thus, demand will be always to a price and time. Demand has the following features.
- Desire for the commodity.
- Ability to buy the commodity.
- Willing to pay the price of commodity.
- Demand is always at a price.
- Demand is per unit of time i.e, per day, week etc. – Therefore the price demand may be expressed in the form of small equation. Dx = f(Px)
Price demand explains the relation between price and quantity demanded of a commodity. Price demand states that there is an inverse relationship between price and demand.
Law of demand :
Marshall defines the law of demand as, “The amount demanded increases with a fall in price and diminishes with a rise in price when other things remain the same”. So, the law of demand explains the inverse relationship between the price and quantity demanded of a commodity.
Demand schedule:
It means a list of the quantities demanded at various prices in a given period of time in a market. An imaginary example is given below.
| Pricein? | Quantity Demanded in units |
| 5 | 10 |
| 4 | 20 |
| 3 | 30 |
| 2 | 40 |
| 1 | 50 |
The table shows that as the price falls to ₹1/- the quantity demanded is 50 units, when price ₹ 5/- he is buying 10 units. So, there is inverse relationship between price and demand. Price is low demand will be high and price is high demand will be low. We can illustrate the above schedule in a diagram.
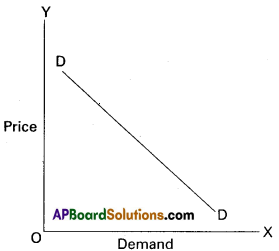
In the above diagram, on X-axis demand is shown and price is on Y-axis. DD is the demand curve. Demand curves slopes downward from left to right.
Assumptions :
- No change in the income of consumer.
- The taste and preferences of the consumers remain same.
- The prices of related goods remain the same.
- New substitutes are not discovered.
- No expectation of future price changes.
Question 9.
Discuss the types of costs.
Answer:
Cost analysis refers to the study of behaviour of production costs in relation to one or more production criteria, namely size of output, scale of operations, prices of factors of pro-duction and other relevant economic variable. In other words, cost analysis is concerned with financial aspects of production relations as against physical aspects considered in production analysis. A useful cost analysis needs a clear under¬standing of the various cost concepts which are dealt here under.
Types of Costs:
Broadly, types of costs can be classified into three types, namely, money costs, real costs and opportunity costs.
1) Money Costs:
The money spent by a firm in the process of production of its output is money cost. These costs would be in the form of wages and salaries paid to labour, expenditure on machinery, payment for materials, power, light, fuel and transportation. These costs are further divided into explicit costs and implicit costs. The amount paid to all factors of production hired from outside by the producer is called as explicit cost. And the amount of own resources and services applied by the producer in the production process is called as implicit cost.
2) Real Costs:
According to Alfred Marshall, “the pains and sacrifices made by labourers and entrepreneurs / orga¬nizers in the process of production activity are real costs”. The amount of crop (produce) sacrificed by the landlord by giving his land to tenants, the amount of leisure sacri¬ficed by the labourer in extending labour to produce goods, the amount of consumption sacrificed by the in¬vestor by saving his money for investment are some of the examples of real costs.
3) Opportunity Costs:
It is also called as alternative cost or economic cost. Opportunity cost is next best alternative of factors of production. The alternate uses capacity of factors of production signifies opportunity costs. If a fac-tor possesses alternative uses, the factor can be used.only in one activity by forgoing other possibilities. In other words, opportunity cost is nothing but next best alterna-tive foregone by a factor. For example, if a farmer decides to grow wheat instead of rice, the opportunity cost of the wheat would be the rice, which he might have grown rather. Thus, opportunity cost is the cost of foregone alternative.
Short-Run Cost Curve analysis:
In shortrun, the costs faced by a firm can be classified into fixed and variable costs.
4) Fixed Costs:
The fixed costs of a firm are those costs that do not vary with the size of its output. It is due to this, the value of fixed cost is always positive even if production activity does not take place or it is zero. The best way of defining fixed costs is to say that they are the costs which a firm has to bear even when it is temporarily shut down. Alfred Marshall called these costs as ‘Supplementary costs’ or Overhead costs’. E.g. : costs of plant and equipment, rent on buddings, salaries to permanent employees are part of fixed costs.
5) Variable Costs:
On the other hand, Variable costs are those costs which change with changes in the volume of output. Marshall called these costs as ‘prime costs’. Daily wages to employees, payments to raw materials, fuel and power, excise taxes, interest on short-term loans etc., are examples for variable costs.
Question 10.
Compare perfect Competition and Monopoly.
Answer:
| Perfect competition | Monopoly |
| 1. There are large number of sellers. | 1. There is only one seller. |
| 2. All products are homoge neous. | 2. No close substitutes. |
| 3. There is freedom of free entry and exist. | 3. There is no freedom of free entry and exist. |
| 4. There is a difference be-tween the industry and firm. | 4. Industry and firm both are same. |
| 5. Industry determines the price and firm receives the price. | 5. Firm alone determines the price. |
| 6. There is universal price. | 6. Price discrimination is possible. |
| 7. The AR, MR curves are parallel to ‘X’ axis | 7. The AR, MR curve? are different and slopes downs from left to right. |
Question 11.
Explain the concepts of gross profits.
Answer:
Gross profit is considered as a difference between total revenue and cost of production. The following are the components of gross profit:
- The rent payable to his own land or buildings includes gross profit.
- The interest payable to his own business capital.
- The wage payable to the entrepreneur for his management includes gross profit.
- Depreciation charges or user cost of production and insurance charges are included in gross profit.
Net profits: Net profits are reward paid for the organiser’s entrepreneurial skills. Components :
- Reward for Risk Bearing:
Net profit is the reward for bearing uninsurable risks and uncertainties. - Reward for Co-ordination:
It is the reward paid for coordinating the factors of production in right proportion in the process of production. - Reward for Marketing Services:
It is the profit paid to the entrepreneur for his ability to purchase the services of factors of production. - Reward for Innovations:
It is the reward paid for innovations of new products and alternative uses to natural resources. - Wind Fall Gains:
These gains arise as a result of natural calamities, wars and artificial scarcity are also included in net profits.
![]()
Question 12.
Discuss the three definitions of National Income.
Answer:
National Income has been defined in a number of ways. National income is the total market value of all goods and services produced annually in a country. In other way, the total income accruing to a country from economic activities in a year’s time is called national income. It includes payments made to all factors of production in the form of rent, wages, interest and profits.
The definitions of national income can be divided into two classes. They are :
i) traditional definitions advocated by Marshall Pigou and Fisher, and
ii) modern definitions.
1) Marshall’s Definition:
According to Alfred Marshall, “the labour and capital of a country acting on its natural resources, produce annually a certain net aggregate of commodities, material and non-material including services of all kinds. This is the true net annual income or revenue of the country’’. In this definition, the word ‘net’ refers to deduction of depreciation front the gross national income and to this income from abroad must be added.
2) Pigou’s Definition:
According to A.C.Pigou, “National Income is that part of the objective income of the community including of income derived from abroad which can be measured in money”. He has included that income which can be measured in terms of money. This definition is better than the Marshallian definition.
3) Fisher’s Definition:
Fisher adopted consumption as the criterion of national income. Marshall and Pigou regared it as the production. According to Fisher, “the national income consists solely of services as received by ultimate consumers, whether from their material or from their human environment. Only the services rendered during this year are income”.
Fisher definition is better than that of Marshall and Pigou. Because, Fisher’s definition has considered economic welfare which is depending on consumption and consumption represents standard of living.But the definitions advocated by Marshall, pigou and Fisher are not flawless. The Marshallian and Pigou’s defini-tions deal with the reasons for economic welfare. But Fisher’s definition is useful to compare economic welfare in different years.
Question 13.
“Supply creates its own demand”. Explain the statement of J.B. Say.
Answer:
Classical theory of employment or the theory of output and employment developed by economists such as Adam Smith, David Ricardo, Robert Malthus etc., it is based on the J.B Say’s law of market’. According to this law “supply creates its own demand”. The classical theory of employment assumes that there is always full employment of labour and other resources.
According to this law the supply always equals to demand it can be expressed as S=D. Whenever additional output is produced in the economy. The factors of production which participate in the process of production. Earn income in the form of rent, wages, interest and profits. The total income so generated is equivalent to the total value of the additional output produced. Such income creates addition demand necessary for the sale of the additional output. Therefore the question of addition output not being sold does not arise.
Question 14.
What are the characteristics of federal finance?
Answer:
Federal finance means the finance of the central government as well as the state governments and the relationship between the two. In a federal system of finance, all items of revenue and expenditure are divided among the central, state and local governments. All the three forms of government are free make expenditure on their respective heads and to get revenue from their respective sources.
Characteristics of a Federal Finance: The following are some of the important characteristic features of federal finance :
- In the federal finance, the sources of income and heads of expenditure are distributed between the central and state government according to the constitution. Their jurisdiction and rights are clearly defined in the constitution.
- In the federal system the central government provides financial aid to states.
- Although the state government have administered autonomy, yet they remain subordinate to the centre. No state is free to fall apart from central government on its own.
- In case of any financial dispute arising between the central and the state governments, the solution thereof is sought according to the constitutional provisions. India with a federal form of government has a federal finance system.
![]()
Question 15.
Explain the effects of inflation.
Answer:
In a broader sense, the term inflation refers to persistent rise in the general price level over a long period of time. Some of the important definitions are given below :
According to Pigou, “inflation exists when money income is expanding more than in proportion to increase in earning activity”. Crowther defined inflation as, “a state in which the value of money is falling, that is the prices are rising.
Effects of Inflation:
Inflation affects economic activities such as production, distribution, social and political relations in an economy adversely.
A) On Production:
a) Mild inflation stimulates production as it increases the profit margin entrepreneurs.
b) High inflation rate of hyper inflation hinders production.
c) Inflation discourages savings. This affects the capital formation which intum affects products.
B) On Distribution:
The impact of inflation is not uniform on all sections of people. It affects certain sections of the people adversely while certain other sections gain because of inflation. This can be elaborated as follows:
1) Fixed Income Groups:
People belonging to fixed income groups suffer due to inflation because their incomes do not increase as prices of commodities rise.
2) Working Class:
Workers and wage earners in the informal
sector normally work for subsistence living. Even otherwise their wages do not rise as and when prices rise. Such people suffer because of inflation. .
3) Debtors and Creditors:
Inflation results a decline in the value of money. Therefore, creditors lose as the value of money is higher when they have lent and less when they are repaid. But debtors gain because the value of money is high when they borrowed but low when they repay.
4) Consumers and Entrepreneurs:
Consumers lose but entrepreneurs gain because of inflation.
C) On Social Justice Front : Economic inequality leads to unequal opportunities in matters of health, education and employment. This results in social injustice.
D) On Political Front:
Inflation widens social and economic disparities which cause frustration among the sufferers. This provides opportunity for political movements and if the government is not responsive, the movements may threaten the stability of governments.
Question 16.
Discuss money related concepts.
Answer:
Money was invented to overcome the difficulties of the barter system. Several economists have given definitions for money. Some of them are listed hereunder :
- Robertson defined money as ‘anything which is widely accepted in payment for goods or in discharge of other kinds of business obligations”.
- According to Seligman’s definition, ‘money is one that possesses general acceptability”.
Related Concepts of Money:
When we discuss about money, we come across certain terms like currency, liquidity and near-money. They have different meanings. These concepts are related to money. It is necessary to know them clearly without any conceptual ambiguity.
i) Currency:
Currency is the form in which money is circulated in the economy by the monetary authority i.e., the government and the central bank. Currency includes ns and paper notes. It is only one component of money. Money comprises of not only currency but demand deposit a ‘me deposits also.
ii) Liquidity:
The ability of an asset to be converted into money is termed as liquidity. In other words, conversion takes place with ease. Hence, liquidity may be defined as the ability of any asset to act as a direct medium of exchange.
Money acts as a direct medium of exchange. Hence money is considered as the perfect liquid asset. Other assets are not as liquid as money because they are not accepted by the public as medium of exchange. They have to be converted into money to facilitate exchange to take place. They have liquidity but the degree of liquidity varies from asset to asset.
iii) Near Money:
The term near-money refers to those highly liquid assets which are not accepted as money, but can be easily converted into money within a short period.
Here are some examples of near money :
- savings deposits and time deposits in the commercial banks,
- savings deposits in the post offices, and post office bonds,
- stock and shares of joint stock companies.
- d) units of UTI.
- savings bonds and certificates.
- treasury bills, and
- bills of exchange and government securities and securities guaranteed by the government.
These assets are close substitutes of money. Hence, they are called near money or quasi-money.
![]()
Question 17.
Explain simple and subdivided bar diagrams with examples.
Answer:
The following are the common types of diagrams, which are used in statistical analysis.
1. One Dimensional Diagrams:
In such diagrams only one dimensional measurement, i.e, height is used, the width is not considered.
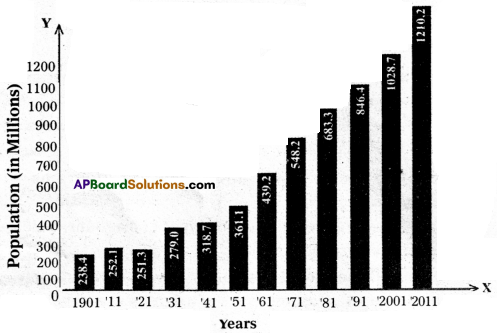
1) Simple Bar Diagrams:
Simple bar diagrams are used to present individual observations, time series and spatial series. The method of drawing simple bar diagram is explained with the help of the example.
Example:
Draw the simple diagram from the following data relating to Censs of India from 1901 to 2011.
Population from 1901 to 2011
Population from 1901 to 2011
| Year | Population (Million) | Year | Population (Million) |
| 1901 | 238.4 | 1961 | 439.2 |
| 1911 | 252.1 | 1971 | 548.2 |
| 1921 | 251.3 | 1981 | 683.3 |
| 1931 | 279.0 | 1991 | 846.4 |
| 1941 | 318.7 | 2001 | 1028.7 |
| 1951 | 361.1 | 2011 | 1210.2 |
2. Subdivided Bar Diagram: Component bar diagram charts are also called as sub-divided bar diagrams, which are very useful in comparing the sizes of different component parts. The following data relates to the number of companies registered in a country.
Registered Companies
| Sector | 1970 | 1971 | 1972 | 1973 | 1974 |
| Public | 125 | 133 | 140 | 150 | 150 |
| Private | 75 | 82 | 90 | 90 | 95 |
| Total | 200 | 215 | 230 | 240 | 245 |
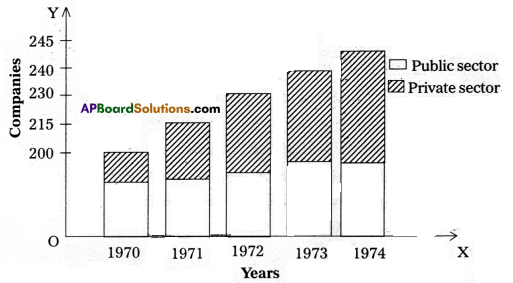
Public and Private Sector Companies Registered
Section – C
Question 18.
What is Price?
Answer:
The price of anything is its value measured in terns of money Ex : A commodity is exchanged for 50 rupees then the price of commodity is 50 rupees.
Question 19.
Explain Economic Goods.
Answer:
Economic goods are man made, they have cost of production and price. They are limited in supply. They have both value in use and value in exchange. Ex : Pen, Book etc.
Question 20.
Define Utility.
Answer:
The want satisfying power or capacity of a commodity or service is known as utility. It is the basis of consumer’s de-mand for a commodity.
![]()
Question 21.
Explain Cardinal Utility.
Answer:
Alfred Marshall developed cardinal utility analysis. According to this analysis, the utilities derived from consumption of different commodities can be measured in terms of arbitary units called utils. 1, 2, 3, 4 are called cardinal numbers.
Question 22.
Prepare Individual Demand Schedule.
Answer:
It explains the relationship between various quantities pur-chased at various prices by a single consumer in the market.
Question 23.
Explain Cross Elasticity of Demand.
Answer:
It is the percentage change in the quantity demanded of a commodity as a result of proportional change in the price of related commodity.
\(\mathrm{Ec}=\frac{\text { Percentage change in quantity demanded of } \mathrm{X}}{\text { Percentage change in the price of } \mathrm{Y}}\)
Question 24.
What are Money Costs?
Answer:
The money spent by a firm in the process of production of its output is money cost. These costs would be in the form of wages and salaries paid to labour, expenditure on machinery, payment for material, power, light, fuel and transportation. These costs are further divided into explicit costs and implicit costs.
Question 25.
Explain the relationship between AC and MC.
Answer:
Average.Cost: Average Cost (AC) is the sum of the Average Variable Cost (AVC) and Average Fixed Cost (AFC). It is to-tal cost divided by the number of units produced. In short, cost per unit is known as average cost (AC).
AC = TC / Q = TFC / Q + TVC / Q = AFC + AVC.
Marginal Cost:
Marginal Cost (MC) is the addition made to the total cost by the production of additional units of output. It is the change in total cost associated with a change in output. We can therefore, write
MC = Change in Total Cost / Change in Output or MCn = TCn-TCn-1
Question 26.
What is product differentiation?
Answer:
One of the main features of monopolistic competition is product differentiation. This is a market situation in which there are many firms of a particular product, but the product of each firm is in some way or the other way differentiated from the product of the other firms in the market. They are heterogeneous rather than homogeneous. Product differentiation may take the form of brand names, trademarks etc. This means that the products of the firms will have close substitutes and their cross elasticity of demand will be very high.
![]()
Question 27.
Give a note on the Area Based markets.
Answer:
On the basis of area, markets are classified into local, national and international. These markets tell us the size or extent of ’ the market for a commodity. The size of the market for a good depends upon demand for the good, transportation facilities and durability of the good etc.
a) Local Market:
When a commodity is sold at its produced -area it is called local market. Perishable goods like vegetables, flowers, fruits etc., may be produced and marketed in the same area.
b) National Market:
When a commodity is demanded and supplied by people throughout the country it is called national market. Examples are wheat, rice, cotton etc.
c) International Market:
When buying and selling of commodities take place all over the world, then it is called international market. Ex. gold, silver, petrol etc.
Question 28.
What are the determining factors of the surplus of Labour?
Answer:
Supply of labour depends on:
- Size of the population and its age composition.
- Mobility of the factors of production.
- Efficiency of the factors of production.
- Geographical conditions will determine the supply of factors of production.
- Price of the factor determines its supply.
- The supply of a factor depends on its opportunity cost – the minimum earning which it can earn in the next best alternative use.
Question 29.
What is Gross Profit?
Answer:
Gross profit is considered as a difference between total revenue and cost of production.
Gross profit = Net profit + [Implicit rent + Implicit wage + Implicit interest + Depreciation charges + Insurance prer.
Question 30.
What is National Income?
Answer:
National income is the market value of goods and services produced annually in a country.
Question 31.
What are transfer payments? Give examples.
Answer:
The government may provide social security allowances like pensions, unemployment allowances, scholarships etc. These are incomes for some sections of the society even though no productive services are made by them. These are called transfer payments.
![]()
Question 32.
What is public Debt?
Answer:
Public Debt: When the government’s expanding expenditure on various activities exceeds its revenue it has one option i.e., is to go for public debt. A government can borrow funds rom various sources within the country or from abroad. This creates public debt. The instruments of public debt are in the form of various types of government bonds and securities.
Question 33.
What do you mean by full employment?
Answer:
Full employment is a situation in which all those who are willing to work at the existing wage rate are engaged in work.
Question 34.
What is cash credits?
Answer:
Cash credit is a type of loan given by the commercial bank. which facilitates with- drawal of loan amount in instalments as and when necessary.
Question 35.
What is Net Banking? Explain the merits of its.
Answer:
Net banking also called internet or online banking. It is the process of conducting banking transactions over the internet. Viewing bank statements and the status of a bank account online comes under the definitions of net banking.
Question 36.
Explain the concept of Geometric mean.
Answer:
Geometric mean (G.M.):
The Geometric mean is a special type of average where we multiply the numbers together and then take a square root (root two numbers), cube root (for three numbers), fourth root (for four numbers) etc., and for ‘n’ numbers n<sup>th</sup> root \((\sqrt[n]{ })\). It is technically defined as ‘the n<sup>th</sup> root product of ‘n’ numbers’. For instance, the geometric mean ‘ of two numbers, say 2 and 8, is the square root of their product, i.e., \(\sqrt{2.8}\) = 4 As another example, the geometric mean of three numbers, say 2, 3 and 6 is the cubic root of their product, i.e., \(\sqrt[3]{2.3 .6}\) = 3.3
Symbolically G.M. = \(\sqrt[n]{X_1, X_2, X_3 \ldots . . X_n}\)
Where, G.M. = geometric mean; n = number of items and X = values of the variable.
Question 37.
What is a Pie diagram?
Answer:
Pie – Diagram : This diagram enables us to show the parti-tioning of total into component parts. It is also called a pie chart.