The strategic use of TS Inter 1st Year Economics Model Papers Set 1 allows students to focus on weaker areas for improvement.
TS Inter 1st Year Economics Model Paper Set 1 with Solutions
Time: 3 Hours
Maximum Marks: 100
Section – A
Note : Answer ANY THREE out of the following five questions in not exceeding 40 lines each. (3 × 10 = 30 )
Question 1.
Discuss the law of diminishing marginal utility, its limita-tions and importance.
Answer:
Hermann Heinrich Gossen was the first economist to explain the law of diminishing marginal utility in 1854. It is also known as Gossen’s ‘first law’. In 1890, Marshall in his principles of economics developed and popularised this analysis. This law explains the functional relationship between the stock of commodity and the marginal utility of commodity.
According to Marshall, “The additional benefit which a person derives from a given increase of his stock of a thing diminishes with every increase in stock that he already has”. “As a consumer increases the consumption of any one commodity, keeping constant the consumption of all other commodities, the marginal utility of the variable commodity must eventually decline”. Kenneth E.Boulding. The law says that as we gone consuming a commodity, satisfaction that derives from its additional units goes on diminishing.
Assumptions :
1) Rationality : Consumer is a rational man which means he always tries to get maximum satisfaction.
2) Cardinal Measurement of Utility : Utility is a cardinal concept i.e., utility can be measured and compared nu-merically.
3) Utilities are Independent: It implies that utility of any commodity depends on its own quantity.
Explanation of the law:
The law of diminishing marginal utility explains the relation between the quantity of goods consumed and its marginal utility. If a person goes on in-creasing his stock of a thing, the marginal utility derived from an additional unit declines. We show this tendency with an imaginary table given below.
| Unit of X apples | Total utility | Marginal utility |
| 1 | 40 | 40 – 0 = 40 |
| 2 | 70 | 70 – 40 = 30 |
| 3 | 90 | 90 – 70 = 20 |
| 4 | 100 | 100 – 90 = 10 |
| 5 | 100 | 100 – 100 = 0 |
| 6 | 90 | 90 – 100 = -10 |
In the table, let us suppose that one is fond of apples. As he consumes one apple after another he derives less and less satisfaction. The first unit is consumed with utmost pleasure. For the second, the intensity of his desire diminishes. The third will be still less and so on. The total utility increases until the consumption of fourth unit of good but at diminishing rate. Fifth unit of apple gives him maximum total utility. But, marginal utility becomes zero. Further consumption of sixth unit TU diminishes and MU becomes negative.
The relationship between total utility and marginal utility is explained in the following three ways :
- When total utility increases at diminishing rate, marginal utility falls.
- When total utility is maximum, marginal utility becomes zero.
- When total utility decreases, marginal utility becomes negative.
This can be shown in the following diagram.
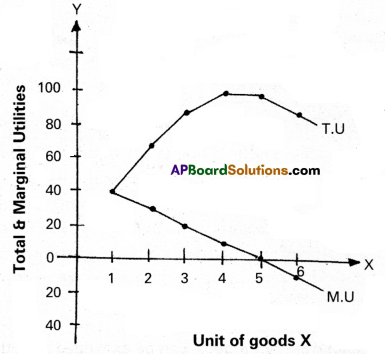
In the diagram, on ‘X’ axis measures units of apples and on Y axis measures total utility and marginal utility. TU curve represents total utility and MU curve represents marginal utility. TU curve is maximum at 5th unit where MU curve will become zero. TU curve slopes downwards from 6th unit, while MU become negative.
Limitations or Exceptions :
- Hobbies: This law does not operate in the case of hob-bies like collection of stamps, old paintings, coins etc. Greater the collections of a person, greater is his satisfac¬tion. Marginal utility will not diminish.
- Drunkers: It is pointed out that the consumption of li-quor is not subject to the law of diminishing marginal utility. The more a person drinks liquor, the more he likes it.
- Miser: This law does not apply to money. The more money a person has the greater is the desire to acquire still more of it.
- Further, this law does not hold good if there is any change in income tastes and preferences of the consumer.
Importance of the Law : The importance of the law of di-minishing marginal utility is as follows:
- The law of diminishing marginal utility is the basic law of consumption and it is the basis for the law of demand, the law of equi-marginal utility etc.
- The changes in design, pattern and packing of goods will be brought by the producers by keeping this law in view.
- The law explains the theory of value that the price of a good falls, when supply increases. Because with the in-crease in the stock of a good, its marginal utility dimin-ishes.
- Diamond-water paradox can be explained with the help of this law. Due to relative scarcity, diamonds possess high exchange value and less use value. Similarly, water is relatively abundant and so it posseses low exchange value but more use value.
- This law helps the government while formulating taxa-tion policies. The principle of progressive taxation is based on the law of diminishing marginal utility. This law is more useful in the policies of redistribution of income and wealth in favour of the poor people.
![]() .
.
Question 2.
Explain short-run costs of a firm with suitable graphs and illustrations.
Answer:
Costs are divided into two categories i.e.,
1. Short run cost curves
2. Long run cost curves.
In short run by increasing only one factor i.e., (labour) and keeping other factor constant. The short run cost are again divided into two types.
1. General costs
2. Economic costs.
- General Costs :
- Money Costs :
Production is the outcome of the ef-forts of factors of production like land, labour, capital ‘ and organisation. So, rent to land, wage to labour, in-terest to capital and profits to entrepreneur has to be paid in the form of money is called money cost. - Real Cost:
Adam Smith regarded pains and sacri-fices of labour as real cost. So, it cannot be measured interms of money. - Opportunity cost:
Factors of production are scarce and have alternative uses. The opportunity cost of a factor is the benefit that is foregone from the next best alternative use.
- Money Costs :
- Economic Costs :
- Fixed Costs:
The cost of production which remains constant even when the production may be increased or decreased is known as fixed cost. The amount spent by the cost of plant and equipment, permanent staff are treated as fixed costs. - Variable Cost:
The cost of production which is changing according to changes in the production is said to be variable cost. In the long period all costs are variable costs. It includes prices of raw materials, payment of fuel, excise taxes etc. Marshall called it as “Prime cost”. - Average Cost:
Average cost means cost per units of output. If we divided total cost by the number of units produced, we will get average cost.
AC = \(\frac{\text { Total cost }}{\text { Output }}\) - Marginal Cost:
Marginal cost is the additional cost of production producing one more unit.
MC = \(\frac{\Delta \mathrm{TC}}{\Delta \mathrm{Q}}\) - Total cost: Total cost is the sum of total fixed cost and total variable cost.
TC = FC + VC
- Fixed Costs:
The short term cost in relation to output are explained with the help of a table.
| Output (Q) | Total Fixed Cost (FC) | Total Variable Cost (VC) | Total cost (TC) | Average Cost (AC) | Marginal Cost (MC) |
| 1 | 30 | 5 | 35 | 35 | 35 |
| 2 | 30 | 8 | 38 | 19 | 3 |
| 3 | 30 | 10 | 40 | 13.3 | 2 |
| 4 | 30 | 14 | 44 | 11 | 4 |
| 5 | 30 | 24 | 54 | 10.8 | 10 |
| 6 | 30 | 40 | – 70 | 11.6 | 16 |
In the above table shows that as output is increased in the 1st column, fixed cost remains constant. Variable costs have changed as and when there are changes in output. To produce more output in the short period, more variable factors have to be employed. By adding FC & VC we get total cost at different levels of output. AC falls output increases, reaches its minimum and then rises MC also change in the total cost associated with a change in output. This can be shown in the diagram.
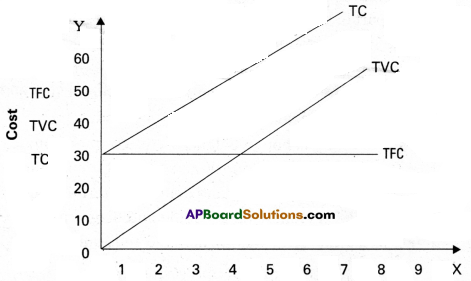
In the above diagram is on ‘OX’ axis taken by output and ‘OY’ axis is taken by costs. The shapes of different cost curves explain the relationship between output and different costs. TFC is horizontal to ‘X’ axis. It indicates that increase in output has no effect on fixed cost. TVC on the other side increases along with level of output. TC curve rises as output increases.
Question 3.
Explain the meaning of perfect competition. Illustrate the mechanism of price determination under perfect compe-tition.
Answer:
Perfect Competition :
Perfect competition is a market sructure characterized by a complete absence of rivalry among the individual firms. Thus, perfect competition in economic theory has a meaning diametrically opposite to the everyday use of this term. In practice, businessmen use the word competition as synonymous to rivalry. In the theory, perfect competition implies no rivalry among firms. Perfect competition may be defined as that market situation, in which there are large number of firms producing homogeneous product, there is free entry and free exit, perfect knowledge on the part of buyer, perfect mobility of factors of production and no transportation cost at all.
Price Determination under Perfect Competition :
Under perfect competition, sellers and buyers cannot decide the price, Industry decides the price of the good. Market brings about a balance between the commodities that come for sale and those demanded by consumers. It means, the forces of supply and demand determine the price of the good. The following schedule and diagram help us to understand changes in supply, demand and equilibrium price.
| Demand and Supply Schedule Price (In Rupees) | Quantity supplied (in KGs) | Quantity Demanded (in KGs) |
| 10 | 20 | 60 |
| 20 | 30 | 50 |
| 30 | 40 | 40 |
| 40 | 50 | 30 |
| 50 | 60 | 20 |
The above table shows the demand and supply schedules of a good. Changes in price always lead to change in supply and demand. As price increases, there is a fall in the quantity demanded. It means, price and quantity demanded have a negative relationship. At the sametime, if price of a commodity increases there is an increase in the quantity supplied. Therefore, the relation between price and supply of goods is positive. It can be observed from the table that when the price is ₹ 10/-, market demand is 60 kgs and supply is 20 kgs.
When the price increases to ₹ 20/-, the supply increases to 30 kgs and demand falls to 50kgs. If the price increases to ₹ 50/-, the supply increases to 60 kgs and demand is only 20 kgs. When the demand is less, price tends to decrease towards equilibrium price. When the price is ₹ 30/-, the demand and supply are equal to 40 kgs. This price is called equilibrium price which is ₹ 30, and equilibrium output and demand is 40 kgs. This process is explained with the help of figure.
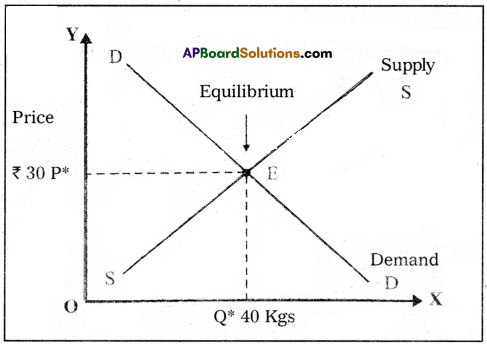
In the figure, the demand and supply of a commodity are shown on OX axis and the price of the commodity on OY axis. As per the diagram, the equilibrium price is found at a point where both demand and supply curves intersect each other at point E, i.e., OP price is the equilibrium price and OQ quantity is the equilibrium supply and demand.
Question 4.
Define rent and explain critically the Ricardian theory of rent.
Answer:
David Ricardo was a 19th century economist of England, who propounded a systematic theory of rent. Ricardo defined rent as “that portion of the procedure of earth which is paid to the landlords for the use of the original and indestructible powers of soil”. According to Ricardo, rent arises due to differential in surplus occurring to agriculturists resulting from the differences in fertility of soil of different grades of land.
Ricardian theory of rent is based on the principle of demand and supply. It arises in both extensive and intensive cultivation of land. When land is cultivated extensively, rent on superior land equals the excess of its produce over that of the inferior land. This can be explained with the following illustration.
We can imagine that a new island is discovered. Assume a batch of settlers go to that Island. Land in this Island is differ in fertility and situation. We assume that there are three grades of land A, B, and C. With a given application of labour and capital superior lands will yield more output than others. The difference in fertility will bring about differences in the cost of production, on the different grades of land. They first settle on ‘A’ grade land for cultivation of corn. ‘A’ grade land yields say, 20 quintals of corn with the investment of ₹ 300.
The cost of production per quintal is ₹ 15 (300/20). The price of corn in the market has to cover the cost of cultivation. Otherwise the farmer will not produce com. Thus, the price in the present case should be atleast ₹ 15 per quintal. As time passes, population increases and demand for land also increases. In such a case, people have to cultivate next best land, i.e., ‘B’ grade land. The same amount of f 300 is spent ‘A’ on ‘B’ grade land gives only 15 quintals of corn as ‘B’ grade land is less fertile.
The cost of cultivation on ‘B’ grade land risen to ₹ 20 (300/15) per quintal of com. If the price of corn per quintal in the market is then ₹ 20, the cultivator of ‘B’ grade land will be not cultivate. Therefore, the price has to be high enough to cover the cost of cultivation on ‘B’ grade land. Hence, the price also rises to ₹ 20. There is no surplus on ‘B’ grade land. But on ‘A’ grade land, the surplus is 5 quintals or ₹ 100 (5 × 20).
Further, due to growth of population demand for land and corn increased. This necessitates, the cultivation of ‘C’ grade land with ₹ 300 investment cost. It yields only 10 quintals of com. Therefore, the per quintal production cost rises to 30 (300/10). Then the price per quintal must be atleast ? 30 to cover the cost of production. Otherwise ‘C’ grade land will be withdrawn from cultivation. At price ₹ 30 ‘C’ grade land yield no surplus or rent. But A grade land yields still layer surplus of 10 quintals or ₹ 300 (10 × 30). But surplus or rent on ‘B’ grade land has 5 quintals or ₹ 150 (5 × 30). But there is no surplus or rent on ‘C’ grade land. It covers just the cost of cultivation. Hence, ‘C’ grade land is a marginal land which earns no rent or surplus.
This can also be explained with the following table.
| Types of land | Cost of production | Produce(Quintals)₹ | Price | Total Revenue | Rent or Surplus |
| In physical In value units form (₹) | |||||
| A | 300 | 20 | 15 | 300
400 600 |
–
5 10 |
| B | 300 | 15 | 20 | 300
450 |
5
– |
| C | 300 | 10 | 30 | 300 | – |
The essence of Ricardian theory of rent.
- Rent is a pure surplus.
- Rent is differential surplus.
- Rent does not determine or enter into price.
- Diminishing returns applies to agri-cultural production.
- Land is put to only one use, i.e., for cultivation.
Ricardian theory of rent can be explained with the help of the above diagram:
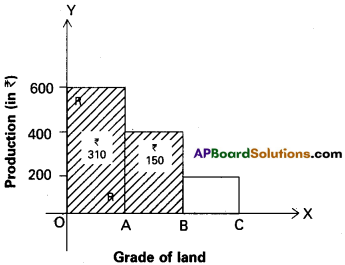
In the above diagram, the shaded area represents the rent or differential surplus. The least fertile land, i.e., C does not carry any rent. So it is called marginal land or no rent land.
![]()
Question 5.
Critically examine the classical theory of employment.
Answer:
The theory of output and employment developed by econo-mists such as Adam Smith, David Ricardo, Malthus is known as classical theory. It is based on the famous “Law of markets” advocated by J.B. Say. According to this law “supply creates its own demand”. The classical theory of employment assumes that there is always full employment of labour and other resources. The classical economists ruled out any general unemployment in the long run. These views are known as the classical theory of output and employment.
The classical theory of employment can be three dimensions.
A. Goods market equilibrium
B. Money market equilibrium
C. Equilibrium of the labour market (Pigou wage cut policy)
A) Goods market equilibrium:
The 1st part of Say’s law of markets explains the goods market equilibrium. According to Say “supply creates its own demand”. Say’s law states that supply always equals demand. Whenever additional output is produced in the economy, the factors of production which participate in the process of production. The total income generated is equivalent to the total value of the output produced. Such income creates additional demand for the sale of the additional output. Thus there could be no deficiency in the aggregate demand in the economy for the total output. Here every thing is automatically adjusting without need of government intervention.
The classical economists believe that economy attains equilibrium in the long run at the level of full employment. Any disequilibrium between aggregate demand and aggregate supply equilibrium adjusted automatically. This changes in the general price level is known as price flexibility.
B) Money market equilibrium:
The goods market equili-brium leads to bring equilibrium of both money and labour markets. In goods market, it is assumed that total income spent the classical economists agree that part of the income may be saved. But the savings is gradually spent on capital goods. The expenditure on capital goods is called investment. It is assumed that equality between savings and investment is brought by the flexible rate of interest. This can be explained by the following diagram.
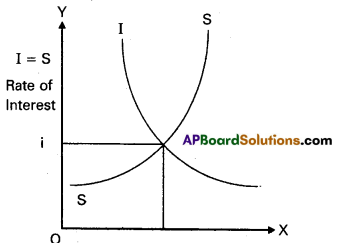
In the diagram savings and investment are measured on the ‘X’ axis and rate of interest on Y axis. Savings and investments are equal at ‘Oi’ rate of interest. So money market equilibrium can be automatically brought through the rate of interest flexibility.
C) Labour market equilibrium:
According to the classical economists, unemployment may occur in the short run. This is not because the demand is not sufficient but due to increase in the wages forced by the trade unions. A.C. Pigou suggests that reduction in the wages will remove unemployment. This is called wage – cut policy. A reduction in the wage rate results ‘in the increase in employment.
According to the classical theory supply of and demand for labour are determined by real wage rate. Demand for labour is the inverse function of the real wage rate. The supply of labour is the direct function of real wage rate. At a particular point real wage rate the supply of and the demand for labour in the economy become equal and thus equili-brium attained in the labour market. Thus there is full employment of labQur. This can be explained with the help of diagram.
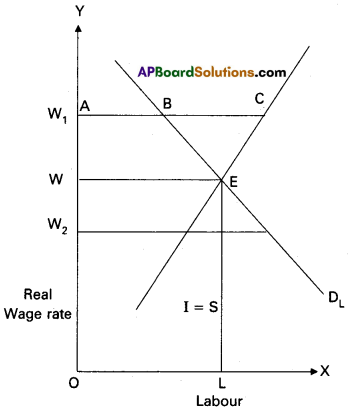
In the above diagram supply of and demand for labour is measured on the X – axis. The real wage ratg is measured on the Y axis. If the wage rate is OWp the supply of labour more than the demand for labour. Hence the wage rate falls. If the real wage rate is-OW2, the demand for labour is more than supply of labour. Hence the wage rate rises. At OW, real wage rate the supply and demand are equal. This is equilibrium.
Assumptions:
1. There is no interference Of government of the economy.
2. Perfect competition in commodity and labour market.
3. Full employment.
Section – B
Question 6.
Distinguish between Macro-economics and Macro-economics.
Answer:
Differences between Microeconomics and Macroeconomics
| Microeconomics | Macroeconomics |
| 1. The word mikro derived from the Greek word “micros” means “small”. | 1. The word makro derived from the Greek word “macros” means “large”. |
| 2. Microeconomics is the study of individual units of the economy. | 2. Macroeconomics is the study of eco-nomy as a whole. |
| 3. It is known as ‘price theory’. | 3. It is known as ‘income and employment theory’. |
| 4. It explains price determination in both commodity and factor markets. | 4. It deals with national income, total employment, aggregate savings and in¬vestment, general price level and economic development etc. |
| 5. It is based on price mechanism which depends oh de¬mand and supply. | 5. It is based on aggregate de-mand and aggregate supply |
| 6. It is based on partial equilibrium analysis which explains the equilibrium of an individual unit. | 6. It is based on general equi-librium analysis which ex-plains the simultaneous equilibrium in all the sectors of the economy. |
| 7. It is a static analysis without time element. | 7. It is a dynamic analysis with time element. |
Question 7.
What is an indifference curve? What are its assumptions?
Answer:
Indifference curve : An indifference curve represents satisfaction of a consumer from two commodities. An IC curve can be defined as the locus of points each representing a different combination of two goods yielding the same level of satisfaction.
Assumptions:
- Rationality:
It is assumed that the consumer tries to obtain maximum satisfaction from his expenditure. - Scale of preference:
Consumer is able to arrange the available combinations of goods according to scale of preference. - Ordinal utility:
It assumes ordinal utility approach. So utility is in measurable only ordinal terms i.e., 1st, 2nd, 3rd etc. - Diminishing marginal rate of substitution:
It is the rate at which a consumer is willing to substitute commodity to another. So that this satisfaction remains the same. - Consistency:
Consumer’s choices have to be consistent. It means if consumer prefers A to B and B to C his choice reflects his rationality. - Completeness:
The consumer’s scale of preferences is to complete that he is able to choose any one of the two
combinations of commodities presented to him.
![]()
Question 8.
What are the factors that determine the demand?
Answer:
There are a number of factors that determine the demand for a good. The demand function shows the relationship between the demand and the factors that determine the demand for a good. The following are some of the important factors that determine demand :
1. Price of the Commodity:
The demand for a commodity is inversely related to its price. If the price of a commodity de¬creases its demand will increase and vice-versa. The demand for any good depends on its price being other things remaining constant. More quantity will be demanded at a lower price and vice-versa.
2. Prices of Substitutes and Complementaries:
Demand is also influenced by the changes in the prices of related goods i.e., either substitutes or complementaries. Prices of substi¬tutes influence the demand for a commodity up to a certain extent. For instance, an increase in the price of coffee leads to an increase in the demand for tea. In case of substitutes, there exists a positive relationship between the price and the quantity demanded. Automobiles and fuel are comple¬mentary goods. In case of complementaries there exists a negative relationship between the price and the quantity demanded. ‘
3. Income of the Consumer:
Income of the consumer is another important determinant. An increase in the income of a consumer leads to an increase in his purchasing power or quantity demanded. Being other things remaining constant, whenever the income of a consumer increases the demand for normal goods increases but the demand for inferior goods decreases.
4. Tastes and Preferences:
Demand for a commodity may change due to change in tastes, preferences and fashions. Tastes vary from person to person. Tastes do not remain the same forever. An increase in the use of trousers reduced the demand for dhotis due to change in fashions. Advertisements also influence the demand for a particular commodity.
5. Population:
Size of population of a country is another important determinant of demand. In other words, a change
in the size of population will affect the demand for certain goods. For instance, larger the population more will be the demand for certain goods like food grains, clothes, housing etc.
6. Technological Changes:
Due to technical progress, new discoveries enter the market. As a result, old goods are substituted by new goods. For instance, increase in the demand for cell phones’ reduced the demand for ‘land line’ phones.
7. Change in Weather:
Demand for a commodity may change due to a change in climatic conditions. For instance, during summer demand for cool drinks, cotton clothes and ACs increases. During winter demand for woolen clothes increases.
8. State of Business:
During the period of prosperity demand for commodities will expand and during depression demand will contract. Therefore, demand for goods depends on the state of business and economic activities.
9. Explain the relationship between Average cost and Marginal cost.
Answer:
Cost analysis refers to the study of behavior of production costs in relation to one or more production criteria, namely, size of output, scale of operations, prices of factors of pro¬duction and other relevant economic variables. In other words, cost analysis is concerned with financial aspects of production relations as against physical aspects considered in production analysis. A useful cost analysis needs a clear understanding of the various cost concepts which are dealt hereunder.
Relationship Between Average Cost and Marginal Cost :
Average cost (AC) is the sum of Average Variable Cost (AVC) and Average Fixed Cost (AFC). It is total cost divided by the number of units produced. In short, cost per unit is known as Average Cost (AC). AC = TC / Q = TFC / Q + TVC / Q = AFC + AVC. Marginal Cost (MC) is the addition made to the total cost by the production of additional units of output. It is the change in total cost associated with a change in output. We can therefore, write MC = Change in Total Cost / Change in Output = ∆TC / ∆Q or MCn = TCn – TCn-1
As per the nature of costs, both AC and MC curves gradually decrease, reach to minimum and gradually increase thereafter along with increase in level of output. It is to be noted that both AC and MC curves will have ‘U’ shape implying three phases i.e., decreasing, minimum (constant) and increasing. This is shown with the help of the following diagram.
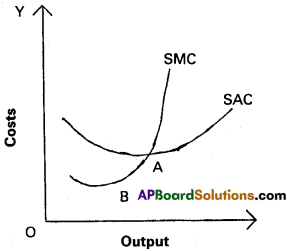
By the figure, output is measured on OX axis and costs on OY axis. It can be seen from this graph that in the beginning as output increases, both AC and MC decrease but the rate of decrease in MC is more than the decrease in AC. At point A, AC = MC and after this point both AC and MC increase but rate of increase in MC is greater than the rate of increase in AC.
Properties of AC and MC:
- Both AC and MC curves are U shaped.
- As output increases, both AC and MC decrease in the beginning.
- MC curve cuts AC curve from its minimum points, at which point AC = MC.
- Both AC and MC increase after certain level of output.
Question 10.
What is monopoly? What are its characteristics?
Answer:
Monopoly is totally a different market situtation compared with perfect competition. The word ‘mono’ means single, and ‘poly’ means seller. Monopoly is said to exist when one firm is the sole producer of a product Which has no close substitutes. In the words of Bilas, “Monopoly is represented by a market situation in which there is a single seller of a product for which there are no close substitutes, this single seller is unaffected by and does not affect the prices and outputs of other products sold in the economy”. Characteritics of Monopoly:
a) A single firm produces the good in the market.
b) No close substitutes to this good.
c) Strong barriers exist for the entry of new firms into the market.
d) Industry and firm is one and same.
e) Producer can control either price or quantity of the good. But he / she cannot determine both price and quantity of the good simultaneously.
Equilibrium and Price Determination under Monopoly:
Price, output and profits under monopoly are determined by the forces of demand and supply. The monopolist will have complete control over the supply of the product. He also possesses the pbwer to set the price to attain maximum profit.
However, he cannot do both the things simultaneously, Either he pan fix the price and leave the output to be determined by the consumer demand at this price or he can fix the output to be produced and leave the price to be determined by the consumer demand for his product.
Question 11.
Point out the assumptions and limitations of marginal productivity theory.
Answer:
Marginal Physical Product (MPP) is the additional output obtained by using an additional unit of the factor of production. If we multiply the additional output by market price we will get Marginal Value Product (MVP) or Marginal Revenue Product (MRP). MRP is the addition made to total ‘ revenue by employing one more unit of factor. The marginal revenue productivity of a factor increases initially with the increase in the units of the factor of production, then reaches to maximum and after that it diminishes and will tend to equal the price of the factor service (average factor cost = AFC). This tendency of diminishing marginal revenue productivity follows from the assumption law of variable proportion.
Assumptions of the Theory :
The theory is based on the following assumptions :
- There is perfect competition in the factor market and commodity market.
- All the units of a factor are homogeneous.
- The theory assumes full employment of the factors.
- There is perfect mobility of the factors of production.
- Substitution is possible between the factors.
- The entrepreneurs are motivated by the profits.
- Various units of the factors are divisible.
- The theory is applicable in the long run.
- It is based on the law of variable proportions.
- Marginal production of a factor can be measured.
Criticism:
The marginal productivity theory of distribution is based on unrealistic assump-tions. Hence, it has been criticized.
- There is no perfect competition in the factor market and commodity market.
- All the factor units are not homogeneous.
- Factors are not fully employed.
- Factors are not perfectly mobile.
- Substitution is not always possible between the factors.
- Profit motive is not the main motive.
- All factors are not divisible.
- This theory is not applicable in the short run.
- Production is not the result of one factor alone.
- The sum of factor payments is not equal to the value of product.
The marginal productivity theory is not an adequate explanation of the determination of the pricing of factors of production. Inspite of limitations of the theory, it explains the role of productivity in the determination of factor price.
Question 12.
Explain the differences between gross national product at market prices and gross national product at factor prices.
Answer:
National income is the value of all final goods and services produced in a company in a year.
Gross National Product (GNP) : Gross National Product is also known as the gross national product at market prices. Gross national product is the current market value of all final goods and services produced in a country during a year including net income from abroad.
The main components of GNP are:
a) The goods and services purchased by consumers (consumption – C)
b) Gross private domestic investment in capital goods (Investment -I)
c) Goods and services consumed by the government (Govt expenditure – G)
d) Net incomes earned through International trade (value of exports – value of imports, i.e., X – M).
GNP = C + I-G + (X – M).
GNP at Factor Cost:
Gross national product at factor cost is the sum of the money value produced by and accruing to the various factors of production in a year in a country. GNP at market prices includes wages, rent, interest, dividends, undistributed corporate profits, mixed incomes (profits of unincorporated business), direct taxes, indirect taxes, depreciation and net income from abroad. GNP at factor cost includes all items mentioned above in GNP at market prices less indirect taxes. GNP at market prices is always higher than GNP at factor cost. If there are any subsidies to the producers, then to get GNP at factor cost, subsidies are added to GNP at market prices. GNP at factor cost = GNP at market prices = indirect taxes + subsidies.
![]()
Question 13.
Explain the concept of effective demand.
Answer:
Effective demand means where aggregate demand equals the aggregate supply. When aggregate demand is equal to aggregate supply the economy is in equilibrium. This can be shown in the table.
| Level of employment | Aggregate supply price | Aggregate demand price |
| 10 | 500 | 600 |
| 11 | 550 | 625 |
| 12 | 600 | 650 |
| 13 | 650 | 675 |
| 14 | 700 | 700 AD = AS |
| 15 | 750 | 725 |
| 16 | 800 | 750 |
In the table when the level of employment is 14 lakh workers, aggregate demand price is equal to aggregate supply price i.e., ₹ 700 crores. This can be shown in the following diagram.
In the above diagram aggregate demand price curve (AD) and the aggregate supply price curve (AS) interest each other at point E1. It shows the equilibrium point. The equilibrium has been attained at ON1 level of employment. It is assumed that ON1 in the above diagram does not indicate full employment as the economy is having idle factors of production. So it is considered as under-employment equilibrium.
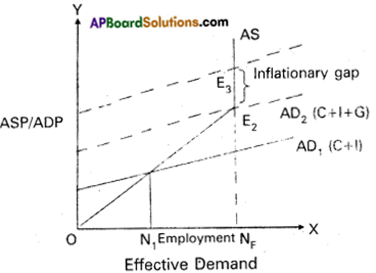
According to Keynes, to achieve full employment an upward shift of aggregate demand curve is required. This can be possible through government expenditure on goods and services supplied in the economy, whenever private entrepreneurs may not show interest to invest. With this the AD1 curve (C + I) shift as AD<sub>2</sub> (C + I + G) at new point of effective demand E2, where the economy reaches full employment level i.e., ONF.
Question 14.
Write a note on Finance Commission and its functions.
Answer:
The Finance Commission of India came into existence in 1951. It was established under Article 280 of the Indian Constitution by the President of India. It was formed to define the financial relations between the centre and the state. As per the Constitution, the commission is appointed for every five years and consists of a chairman, secretary and four other members. The first finance commission submitted its report in 1952.
The finance commission advises the President, what percentage of the income tax should be retained by the centre, and what principles should be adopted to distribute the divisible pool of the income tax among the states. Since the institution of the first finance commission, stark changes have occurred in the Indian economy causing changes in the macro economic scenario. This has led to major changes in the finance commission’s recommendations over the years. Till date, fourteen finance commissions have submitted their reports.
Functions of Finance Commission :
The functions of the finance commission can be explicitly stated as :
1) Distribution of net proceeds of taxes between centre and the states, to be divided as per their respective contribu – tions to the taxes.
2) Determine factors governing grants-in aid to the states and the magnitude of the same.
3) To make recommendations to President as to the measures needed to augment the consolidated fund of a state to supplement the resources of the panchayats and municipalities in the state on the basis of the recommendations made by the finance commission.
Question 15.
Explain the primary and secondary functions of money.
Answer:
Money has many important functions to perform. These functions may be classified as :
- Primary functions,
- Secondary functions,
- Contingent functions, and
- Static and dynamic functions.
1. Primary Functions of Money: The primary functions of money are really as the technical and important functions of money. They are two types :
i) Medium of Exchange:
Money serves as a medium of exchange. It removes the inconveniences of the barter system in which exchange of goods was possible if only there was double coincidence of wants. But money facilitates exchange of commodities without double coincidence wants. Any commodity can be exchanged for money. People can exchange goods and services through the medium of money.
ii) Measure of value:
Money serves as a measure of the value of goods and services. As common measure of value it has removed the difficulty of the barter system and has made transactions simple and easy. The value of each commodity is expressed in the units of money. We call it as price. In view of this function of money, the values of different commodities can be compared and the ratios between the prices of different commodities can be determined easily.
2. Secondary Functions of Money:
Money has two
secondary functions which are stated hereunder:
i) Store of value:
The value of commodities and services can be stored in the form of money. Certain commodities are perishable. If they are exchanged for money before they perish, their value be preserved in the form of money. Otherwise they perish and their value is lost forever. Even in the case of durable commodities, their value may diminish over a period of time. But their value can be stored, without any decline, in the form of money by exchanging them for money.
ii) Standard of Deferred Payments:
Money serves as a standard of deferred payments. In modem economies, most of the business transactions take place on the basis of credit. An individual consumer or a business man may now purchase a commodity and pay for it, in future as this function makes it possible to express future payments in terms of money. Similarly one can borrow certain amount of money now and repay it in future.
iii) Transfer of money:
Money can be transferred from one person to another at any time at any place.
Question 16.
State any three major (general) functions of a central bank.
Answer:
Central bank is the apex institution of the banking system of a country. It controls, regulates, and activities of the country’s banking system. Reserve Bank of India (RBI) is our central bank. It was established on 1st, April 1935 with a share capital of ₹ 5 crore. It was originally owned by private shareholders but was nationalized by the Government of India in 1949. It performs all important functions of the central bank under the Reserve Bank of India Act, 1934. Reserve Bank of India performs the following functions :
General Functions :
1) Note issue:
Reserve Bank of India has the monopoly of note issue in the country. It maintains gold and foreign exchange reserves of a minimum ₹ 200 crores of which gold should be worth ₹ 115 crores. There is a separate issue department to issue currency notes. At present Reserve Bank of India issues currency notes of the denomination ₹ 1,000, ₹ 500, ₹ 100, ₹ 50, ₹ 20, ₹ 10, ₹ 5. One rupee note and coins are issued by the Finance Ministry of the Government of India but circulated by the Reserve Bank of India.
2) Banker to Government:
Reserve Bank of India acts as the banker, agent and adviser to the Government of India. It acts as an agent of the Government of India and all the state governments except the Government of Jammu and Kashmir. It receives money and makes payments on behalf of the government and keep the cash balances as deposits without any interest. It assists the government in floating new loans and the management of public debt. It gives temporary advances to the Government in all financial matters.
3) Banker’s Bank:
Reserve Bank serves as a banker not only to the government but also to the banks. According to Banking Regulation Act, 1934 all the scheduled banks are bound by the law to maintain with the Reserve Bank of India a part of their total deposit amount as cash balances. This ratio is called the Cash Reserve Ratio (CRR).
![]()
Question 17.
What are the characteristics of a good average?
Answer:
Characteristics of goods average :
- It should be based on all the observations.
- It should be rigidly defined. It should be clearly defined. There should be no confusion about the meaning or description of an average.
- It should be capable of future algebaic treatment.
- It should not be unduly affected by extreme values. No item of the series should affect the average too much. If very large items unduly affect the average, then the average cannot represent the entire group.
- It should be easy to calculate and simple to understand.
- It should not be affected by variations of sampling.
Section – C
Question 18.
What is wealth?
Answer:
Wealth means stock of assets held by an individual or institution that has the potential for yielding income in some form. Wealth includes money, shares of companies, land etc. Wealth has three properties.
1. Utility
2. Scarcity
3. Transferability.
Question 19.
What is Normative Economics?
Answer:
Normative economics may be defined as a body of. systematised knowledge relating to the object of “what ought to be’ and concerned with the ideal as distinguished from the actual. Historical school of Germany has introduced this in Economics.
Question 20.
Explain Marginal rate of substitution.
Answer:
The additional amount of one product required to compensate a consumer for a small decrease in the quantity of another, per unit of the decrease. This can be explained with the help of table.
| Combination | Good X | Good Y | MRS Of X and Y |
| 1 | 1 | 15 | |
| 2 | 2 | 11 | 1 : 4 |
| 3 | 3 | 8 | 1 : 3 |
| 4 | 4 | 6 | 1 : 2 |
| 5 | 5 | 5 | 1 : 1 |
By the table, the consumer is ready to sacrifice 4 units of Y to get 1 more unit of X. The MRSxfory diminishes.
Question 21.
What is Price line/budget line?
Answer:
It shows all possible combinations of two goods that a con-sumer can buy, with the given income and prices of the two goods.
Question 22.
Explain Giffen’s paradox (or) Giffen Goods.
Answer:
It means necessary goods. Sir Robert Giffen in mid 19th cen-tury observed that the low paid workers in England pur-chased more bread when its price increased by decreasing in the purchase of meat. The increase in demand for bread when price increased is. an exception to the law of demand, it is known as Giffen’s Paradox.
Question 23.
What is perfectly inelastic demand?
Answer:
Even a great rise or fall in price does not lead and change in quantity demanded is known as perfectly inelastic demand. The demand curve is vertical to V axis.
Question 24.
Explain the External Economies.
Answer:
External economies are those economies which accure to each member firm as a result of the expension of the industry as a whole as the name tells us, these economies are common in nature which benefit all the firms working in an exponding industry external economies are as follows.
Question 25.
Describe the Total fixed cost curve.
Answer:
The fixed costs of a firm are those costs that do not vary with the size of its output. It is due to this the value of fixed costs is always positive even if production activity does not take place or it is zero. The best way of defining fixed costs is to say that they are the costs which a firm has to bear even when it is temporarily shut down. Alfred Marshall called these costs as supplementary costs or over head costs. For examples cost of plant and equipment, rent on building, salaries to permanent employees are part of fixed costs.
![]()
Question 26.
What is Duopoly?
Answer:
When there are only two sellers of a product, there exist duopoly. Each seller under duopoly must consider the other, firms reactions to any changes that he makes in price or output. They make decisions either independently or together.
Question 27.
What are the Selling costs?
Answer:
An important feature of monopolistic market is every firm makes expenditure to sell more output. Advertisements through newspapers, journals, electronic media etc., these methods are used to attract more consumers by each firm.
Question 28.
What are real wages?
Answer:
Real wage is the purchasing power of money wages in terms of goods and services.
Question 29.
What is Net interest?
Answer:
Net interest is the reward for the service of the capital loan. Ex: Net interest paid on government bonds and government loAnswer:
Question 30.
What is Real Per Capita Income?
Answer:
Real National Income when divided by country’s popu-lation, percapita income is obtained.
Per capita Income = \(\frac{\mathrm{Real National Income}}{\mathrm{Total Population}}\)
The average standard of living of country is indicated by per capita income.
Question 31.
What are transfer payments? Give examples.
Answer:
The government may provide social security allowances like pensions, unemployment allowances, scholarships etc. These are incomes for some sections of the society even though no productive services are made by them. These are called transfer payments.
Question 32.
What are the components of a budget?
Answer:
Components of the Budget: The budget consists of both receipts (income) and expenditure of the government. The budget of the Government of India consists of two main components :
1) Budget Receipts : a) Revenue Receipts :
This consists of tax revenue and non – tax revenue and b) Capital Receipts : This consists of recoveries of loans, other receipts and borrowings and other liabilities.
2) Budget Expenditure :
In the Union budget of India, the budget expenditure is classified into plan expenditure and non – plan expenditure. But, Central Government through its Union Budget 2017 – 18 abondoned plan and non – plan expenditure and replaced these items with Revenue Expenditure and Capital Expenditure.
Persual of the budget at a glance gives a vivid pitcture of the structure of the budget and its components as followed by the government of India in actual practice.
![]()
Question 33.
Write, in brief, about GST.
Answer:
GST: Goods and Services Tax (GST) is an Indirect Tax which has replaced many Indirect Taxes in India. The Goods and Service Tax Act was passed in the Parliament on 29th March 2017. the Act came into effect on 1st July 2017; GST is a comprehensive, multi-stage, destination-based tax that is levied on every value addition. In simple words, GST is an indirect tax levied on the supply of goods and services. Under this system four slabs are fixed for GST rates i.e., 5%, 12%, 18% and 28%.
Question 34.
What do you understand by store of value of money?
Answer:
By this functions money preserve the value of perishable commodities in the form of money if they are exchanged before they prism. It stores the value of durable commodities also.
Question 35.
Explain the Types of inflation.
Answer:
Inflation is divided into different bases on its pace or rate of inflation and the causes of
inflation. They are detailed below:
1) Based on the Rate of Inflation:
On the basis of the rate of inflation, it may be classified into four types.
a) Creeping inflation
b) Walking inflation
c) Running inflation
d) Galloping inflation.
2) Based on cause of inflation:
a) Demand pull inflation
b) Cost push inflation.
Question 36.
What are the advantages of diagrams?
Answer:
Diagrams are used with great effectiveness in the presen-tation of all types of data. The advantages of diagrams are as follows:
a) A properly constructed diagram appeals to eye and mind.
b) There is no need to have special mathematical knowledge.
c) Data presentation becomes easier.
d) It facilitates comparison.
e) It improves memory power.
Question 37.
What is the Geometric Mean of two numbers, 4 and 16?
Answer:
Geometric mean of two numbers : 4, 16
| N | X |
| 1 | 4 |
| 2 | 16 |
![]()