Telangana SCERT 10th Class Social Study Material Pdf Telangana 3rd Lesson Production and Employment Textbook Questions and Answers.
TS 10th Class Social 3rd Lesson Questions and Answers – Production and Employment
Question 1.
Do you think the classification of economic activities into primary, secondary and services sectors is useful? Explain how.
Answer:
To understand the behaviour of the different economic activities, and how they impact and in turn are Impacted by the total economy, it s useful to qualify them in larger group of economic activities. One such a way of grouping economic activities is to classify them into primary, secondary and tertiary activities.
1. Primary economic activities include activities such as farming. forestry fishing and mining. They also include the packaging and processing of the extracted materials,
2. Secondary economic activities include all industries manufacturing finished goods. This group consists of many broad industrial sectors such as automobile, chemicals, textiles, engineering equipment and construction.
3. Tertiary activities, also called service sector, provides services to the consumers as well as to other producers. This includes services such as distribution, retail. communication, transport hotels and transport.
Division of all economic activities in these three groups enables us to study and understand many important characteristics of economic behaviour and to understand the nature and state of an economy.
Question 2.
For each of the sectors that we came across in this chapter, why should one focus on employment and GDP? Could there be other issues which should be examined? Discuss.
Answer:
For each of the sectors mentioned in this chapter, our focus should definitely be on employment and GDP. This Is because growth in GDP and full employment are common goals of Five Year Plans and also determine the size of a country’s economy. A focus on employment and GDP helps us to calculate the monitor. the most important factors like per capita income, productivity changes in employment rate and contribution to GOP by the 3 sectors of economy and thus, take necessary steps required for the upliftment of the country’s economy as a whole.
Yes, the other issues which should be examined are –
- balanced regional development.
- equality in income and wealth among the people of the country.
- how to eradicate poverty
- modernization of technology
- self-reliance of the country
- how to achieve surplus food production in the country.
![]()
Question 3.
How is the service sector different from other sectors? Illustrate with a few examples.
Answer:
- The service sector is different from other two sectors.
- The other two sectors produce goods. But the service sector does not produce goods by itself.
- The activities under this sector help in the development of the primary and secondary sectors.
- These activities are an adjunctive or support for the production process.
Question 4.
What do you understand by underemployment? Explain with one example each from the urban and rural areas.
Answer:
Disguised unemployment is a kind of unemployment in which there are people who are visibly employed but are actually unemployed. This is also known as Hidden Unemployment. In such a situation more people are engaged in a work than required.
In rural areas, this type of unemployment is generally found in agricultural sector. e.g.: In a family of 8 people all are engaged in the same agricultural plot. But 3 people are withdrawn from it. There will be no reduction in output, So these 3 people are actually disguisedly in unemployment.
In urban areas, this type of unemployment can be seen mostly in service sectors such as in a family, all numbers are engaged in one petty shop or a small business which can be managed by less number of persons.
Question 5.
The workers in the unorganised sector need protection on the following Issues: wages, safety and health. Explain with examples.
Answer:
The workers in the unorganised sector need protection on the following issues: wages, safety and health.
In the construction sector, labourers are employed on a daily basis. Hence they have no job security. Hence, wages too differ from time to time. Consequently, the government has set up a Minimum Wages Act to protect such workers from exploitation.
The same problem exists for miners working in private mining companies. Their safety is secondary to the company’s profits, As a result, many learners suffer grievous injuries due to inadequate safety gear and norms.
Governments of most nations have now laid down strict rules for private enterprises to ensure worker’s safety.
Most companies in the unorganised sector do not provide health insurance to their employees. Some of these might be involved in dangerous factory production that may harm workers’ health in the long term. These workers need to be protected against the tyranny of the employer, and it is here that the government steps in.
![]()
Question 6.
A study in Ahmedabad found that out of 15,00,000 workers in the city, 11,00,000 worked are In the unorganised sector. The total income of the city In this year (1997-1998) was Rs. 6000 crores. Out of this Rs. 3200 crores was generated In the organised sector. Present this data as a table. What are the ways for generating more employment in the city?
Answer:
Contribution of organised and unorganised sectors in Ahmedabad in 1997 – 98:
| Sector | Employees (Workers) | Generated Income (in crores) |
| Organised | 4,0000 | Rs. 3200 |
| Unorganisd | 11,00,000 | Rs. 2800 |
| Total | 15,00.000 | Rs. 6000 |
Ways to generate more employment in the city of Ahniedabad have to be provided by the government, especially in the unorganised sector. As the table shows, the organised sector’s earnings are much higher than that of the unorganised sector even though the latter employs almost 80% of the city workers.
More companies need to be brought under the root of the organised sector so that workers from the unorganised sector are attracted to obs there, with higher and more secure wages. For this. the government must provide loans and aid to companies transferring from unorganised to organised sectors.
Question 7.
Read the 4th para of page 34, ie.” In the past 50 years …………………… observed in developed
countries”.
In the past 50 years. there has been a further shift from industry to service sector for developed countries. The service sector has become the most important sector in terms of total production. Most of the working people have also made a shift and are now employed in the service sector and most of the production activities are those of services and not manufactured goods. This is the general pattern observed in developed countries. Is a similar pattern observed for India? Give your opinion.
Answer:
- Yes in India, loo, the service sector has become the important in terms of production.
- Employment in service sector has shown an improvement from 15% to 31%.
- The contribution of service sector to GDP has increased from 35% to 53%.
- In India, most of the employees ‘ri service sector are engaged in services such as shopkeepers repair persons. transport persons. etc.
- They render services but do not manufacture any goods.
Question 8.
Observe the ‘pie’ graphs given in page 35 and answer the following questions. Graph: Share of different sectors in Gross Domestic Product 1973-74 2015-16 (2011-12 series at constant prices)
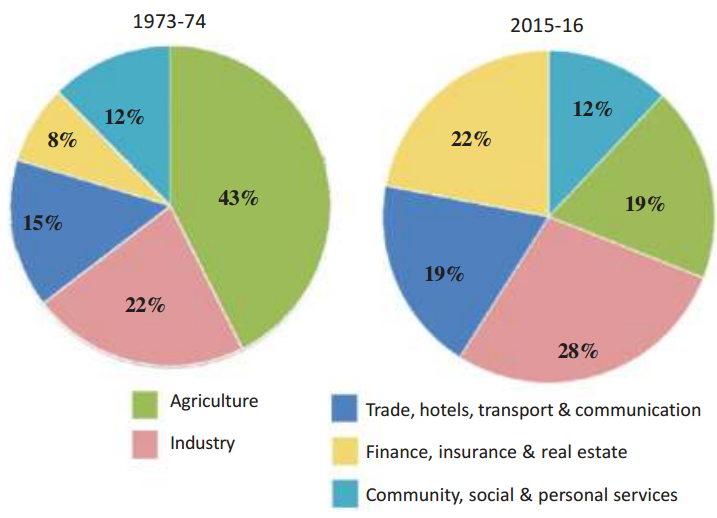
i) In the year 2015-16, In G.D.P. share of which sectors are increased when compared to the year 1973-74?
ii) How much the share of agricultural sector In GDP is decreased In the year 2015-16 when compared to the year 1973-74?
Answer:
i)
- Finance, insurance and reai estate
- Trade, hotels, transport and communication
- Industry
The above are increased.
ii) 24% share of agricultural sector Is decreased.
Question 9.
What points are to be considered while estimating gross domestic product?
Answer:
The following points are considered to es mate the gross domestic product.
- How are goods and services produced in a particular financial year.
- The total production of goods and services from the three sectors.
- Only we include the valuo of final goods and services which are produced from the three sectors.
Due to the above-mentioned points we estimate that how GDP is calculated in a particular year.
Question 10.
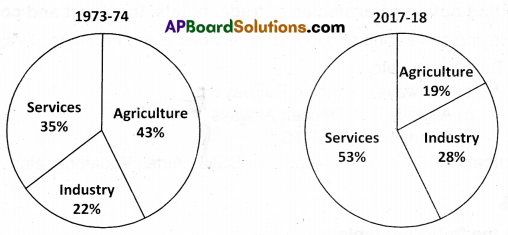
Discuss the changes In shares of different sectors in GDP.
Answer:
The shares of different sectors in GDP:
- In 1973-74 share of Agriculture is 43% but in 2015- 16 the share of agriculture is 19% only.
- In 1973-74 the share of Industrial sector Is 22% but In 2015-16 the share of industrial sector is 28%.
- In 1973 -74 the share of service sector is 35% only, but In 2015- 16 It is 53%.
Explanation:
- The output share of agriculture sector has fallen drastically for 42 years.
- There was a small increase in the share of industrial output ri GDP with an increase of 6%.
- Finally, there is a tremendous increase in the share of service activities – two out of three sub-sectors of service activities have expanded. This is because more number of people give preference to service sector.
Question 11.
Analyse the role of unorganised sector in GDP.
Answer:
The unorganised sector is characterised by smell and scattered units which have remained largely outside the control of government. Almost half of the workers are self-employed. In rural areas, the unorganised sector mostly comprises landless agricultural labourers. small and marginal farmers, artisans. In urban areas, there are small-scale industrial workers and vendors, etc. They earn very low income.
Even though they are earning very less, the unorganised Sector also contributes to GDP. During 2004 -05. the unorganised sector workers accounted for 92% of all workers that contributed halt of all production. In 100% of income to GDP 50% of income is shared
from unorganised sector.
Question 12.
Look at the illustration given on page 32, whet Is the likely chain of production in her case and who would benefit from the value added?
Goods such as paddy, rice and husk In this example aro at the intermediary stages. They ere not being used by the final consumer. They are used as inputs to make the final good, Which in this example is di and dosa. If one were to add the value of all the physkalkipuls in between plus the value of The flnatgoocls, we would be double counting. The value of final goods already includes the value of all the In between intermediate goods that are used in making the final good.
A teach stage, the producer paid for these inputs produced by someone before. Hence, the value of Rs. 5000 north of hotel items sold by hotelier (final good) already includes Rs. 3600, the value of rice and husk used as physical, puffs. This was not made by the hotelier but he or purchased them from the tice miller. Similarity. the nce and husk produced by the Millar at Rs. 3600 already includes the value of physical input paddy (Rs. 2500) purchased by him.
He did not produce paddy. The farmer produced this in stage 1. To count the value of the and paddy sepa ratofrý means counting the value of the same things a number of times- first as paddy, then as rice and husk and finally as di and dosa.
The good becomes final it is not used further in producing goods to be sold. In the above example, if the rice had been bought by a family for their consumption, this would be the final point. idli and dosa would be made by the family for themselves and not as goods to be sold.
Answer:
The primary source of production of idli and Dosa is the paddy. The producer of paddy may be a farmer. The farmer sold the paddy to a miller and the miller made the paddy into rice. He added his efforts in the form of value and fixed the price of rice.
He took his share of benefit lo that extent. Then the hotelier purchased the rice and husk and he also added
value at this stage as per his efforts of inputs. He made idlis and Dosas by using the rice and husk. He used the services of some labourers and paid some amount to them. This is also considered as his input expenditure. That is at last paid by the consumers of the idlis and Dosas.
in this process of chain, every individual, one who has invested or added something. got ones benefit. On the whole we don’t expect that the primary producer has got his benefit. The farmer put his efforts for three to four months for the crop to get After getting the yield, the farmer has no freedom or right to fix its price. The buyer is fixing the price of the paddy that the farmer grow. In this context, the farmer is the owner or producer of the paddy, then he only has to decide its price, but it is not going on in the society. Except the
farmer, everyone is getting one’s benefit. Finally, the farmer gets loss.
![]()
TS 10th Class Social 3rd Lesson Production and Employment Intext Questions
Page No. 29
Question 1.
Classify the following list of occupations under agriculture, industry & and service sectors. Giv, reasons for your classification:
| Occupation | Classification |
| Tailor | |
| Basket weaver | |
| Flower cultivator | |
| Milk vendor | |
| Fishermen | |
| Priest | |
| Courier | |
| Workers in match factory | |
| Moneylender | |
| Gardener | |
| Potter | |
| Bee-keeper | |
| Astronaut | |
| Call centre employee |
Answer:
| Occupation | Classification |
| Tailor | Secondary sector |
| Basket weaver | Secondary sector |
| Flower cultivator | Primary sector |
| Milk vendor | Tertiary sector |
| fishermen | Primary sector |
| Priest | Service sector |
| Courier | Service sector |
| Workers in match factory | Secondary sector |
| Moneylender | Ternary sector |
| Gardener | Primary sector |
| Potter | Secondary sector |
| Bee-keeper | Tertiary sector |
| Astronaut | Tertiary sector |
| Call centre employee | Tertiary sector |
Page No. 30
Question 2.
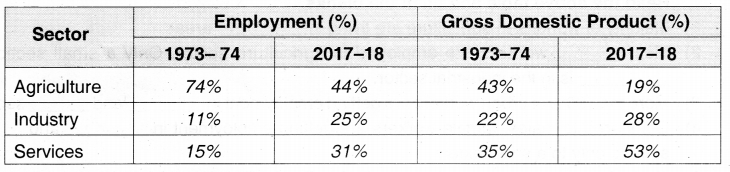
The following table shows the percentage of workers employed in different sectors In India in 1972-73 and in 2015-16. i.e., after 43 years.
| Year | Agriculture | Industry | Services |
| 1972-73 | 74% | 11% | 15% |
| 2017-18 | 44% | 25% | 31% |
(i) What are the major changes that you observe from the above table?
Answer:
There is a great shift from the agricultural sector to industrial and service sectors.
(ii) From what you have read before, discuss what could be some of the reasons for these changes.
Answer:
1. In agricultural sector, the methods of farming have changed. Use of chemical pesticides. increased production of cash crops, reduced dependence on rainfall, use of modern equipments for farming. sprinkling of water, precision farming, etc. are some of the reasons.
2. In manufacturing sector, new machines and tools are being used in production, factories are expanding. Secondary sector became most important in total production and employment.
3) In service sector, new services are being included and expanding rapidly. Knowledge process outsourcing has become the buzzword of this sector.
Question 3.
Observe the pictures and mention the sector which they belong to.
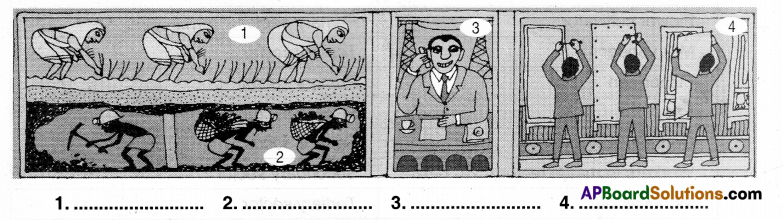
Answer:
- Agriculture sector
- Primary sector (Mining).
- Service sector
- Industrial sector
Page No. 31
Question 4.
Observe the graph.
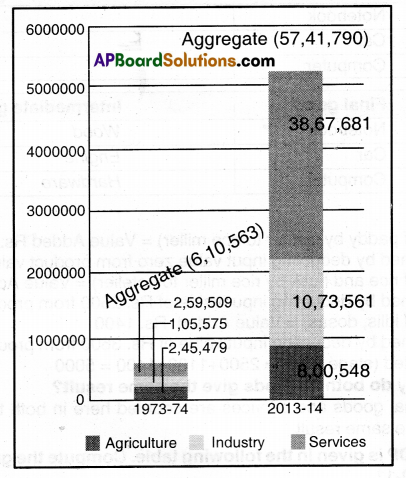
Answer the following questions:
a) Which was the largest producing sector in 1973-74?
Answer:
Agriculture sector.
b) Which was the largest producing sector in 2013-204?
Answer:
Service sector.
![]()
c) Fill In the blank:
The total value of production of goods and services in local increased approximately …………….. times between 1973- 74 and 2013-14.
Answer:
9.4
Page No.32
Question 5.
Total value of goods sold at each stage:
Stage 1 (sale of paddy by farmer to rice mill owner) Rs. 2500
Stage 2 (sale of rice and husk by rice mill owner to hotelier) Rs. 3600
Stage 3 (sale of ¡dli, dosa) Rs. 5000
Discuss: To find out the total value of goods produced, should we add them up?
Answer:
No. we should not add them up
Reason: They are not being used by the final consumer. They are used as inputs to make the final good.
Question 6.
In the, above example, paddy or rice is the intermediate good and ¡dli is the final good. The following are a few goods we consume in our daily lives. List some of the intermediate goods against each one.
| Final good | Intermediate goods |
| 1. Notebook | |
| 2. Car | |
| 3. Computer |
Answer:
| Final good | Intermediate goods |
| 1. Notebook | Wood |
| 2. Car | Engine |
| 3. Computer | Hardware |
Page No. 33
Question 7.
Stage 1 (sale of paddy by farmer to rice miller) = Value Added Rs. 2500
(Obtained by deducting input value zero from prodoct value Rs. 2500)
Stage 2 (sale of rice and husk by rice miller to hotelier) = Value Added Rs. 3600
(Obtained by deducting input value of Rs. 2500 from product value Rs. 3600)
Stage 3 (sale of idilis, dosas) Value Added Rs. 1400
(Obtained by deducting input value of Rs. 3600 from product value Rs. 5000)
Total Value Added (stage wise) =2500+1100+1400 = 5000
Discuss: Why do both methods give the same result?
Answer:
The value of final goods and services are counted here in both the methods. So both methods give the same result.
Question 8.
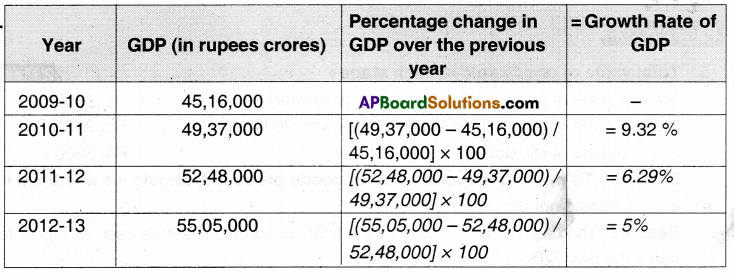
The value of GDP is given ¡n the following table. Compute the growth rate of GDP as shown for 2010-11.
Answer:
Graph: Shares of three sectors in GDP
![]()
Question 9.
Look at the above pie charts given above and till in the following table.
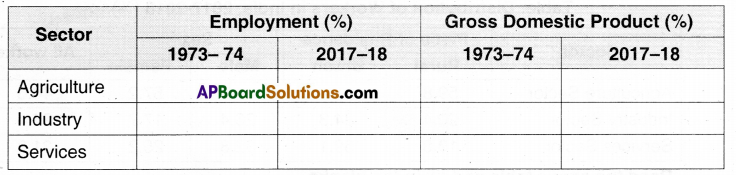
Answer: