The strategic use of AP Inter 1st Year Economics Model Papers and AP Inter 1st Year Economics Question Paper May 2018 allows students to focus on weaker areas for improvement.
AP Inter 1st Year Economics Question Paper May 2018
Note : Read the following instructions carefully :
- Answer ALL the questions as per the choice specified. Draw suitable diagrams wherever necessary.
- Questions from Serial Nos. 1 to 5 in Section ‘A’ are of Long Answer Type. Each question carries TEN marks. ANY THREE questions j may be answered out of five given questions. Every answer may he limited to 40 lines.
- Questions from Serial Nos. 6 to 17 in Section ‘B’ are of Short Answer Type. Each question carries FIVE marks. ANY EIGHT questions may be answered out of twelve given questions. Every answer may be limited to 20 fines.
- Questions from Serial Nos. 18 to 37 in Section ‘C’ are of Very Short Answer Type. Each question carries TWO marks. ANY FIFTEEN questions may be answered out of twenty given questions. Every answer may be limited to 5 fines.
Section – A
Note : Answer ANY THREE out of the following five questions. (3 × 10 = 30)
Question 1.
Explain the law of diminishing Marginal Utility. What are its limitations?
Answer:
Hermann Heinrich Gossen was the first economist to explain the law of diminishing marginal utility in 1854. It is also known as Gossen’s ‘first law’. In 1890 Marshall in his principles of economics developed and popularised this analysis. This law explains the functional relationship between the stock of commodity the marginal utility of commodity.
According to Marshall “The additional benefit which a person derives from a given increase of his stock thing diminishes with every increase in stock that he already has”. “A consumer increases the consumption of any one commodity keeping constant the consumption of all other commodities the marginal utility of the variable commodity must eventually decline”. Kenneth E. Boulding. The law says that as we gone consuming a commodity satisfa¬ction derives from its additional units goes on diminishes.
Assumptions :
- Rationality : Consumer is a rational man which means he always tries to get maximum satisfaction.
- Cardinal measurement of utility : Utility is a cardinal concept, i.e., utility can be measured and compared numerically.
- Utilities are independent : It implies that utility of any commodity depends as its own quantity.
- Homogeneous : Units of the commodity are similar in quantity, size, taste and colour etc.
- No time gap : There should not be any time gap between the consumption of one unit and other it.
- Constant marginal utility : It is assumed that the marginal utility of money remains constant.
- Total & marginal utility :
i) Total utility : Total satisfaction obtained by the consumer from the consumption of a given quantity of commodity.
TUn = f(Qn)
Where TUn = Total utility of n commodity
F = functional relationship
Qn = Quantity of n commodity
ii) Marginal utility: Marginal utility is the addition made to the total utility by consuming one more unit of the commodity. It can be explained as.
MUn = TUn – TUn-1
MUn = Marginal utility of nth unit
TUn = Total utility of nth unit
TUn-1 = Total utility of n-1 units
MU may also be expressed as follows.
Marginal utility is the additional utility derived from the consumption of. an extra unit of commodity.
MU = \(\frac{\Delta \mathrm{TU}}{\Delta \mathrm{C}}\)
Where ∆TU = change in total utility
∆C = change in number of units consumed.
Explanation of the law:
The law of diminishing marginal utility explains the relation between the quantity of good and its marginal utility. If a person goes on increasing his stock of a thing, the marginal utility derived from an additional unit declines. We show this tendency with an imaginary table given below.
| Unit of x apples | Total utility | Marginal utility |
| 1 | 40 | 40 – 0 = 40 |
| 2 | 70 | 70 – 40 = 30 |
| 3 | 90 | 90 – 70 = 20 |
| 4 | 100 | 100 – 90 = 10 |
| 5 | 100 | 100 – 100 = 0 |
| 6 | 90 | 90 – 100 = -10 |
In this table let us suppose that one is fond of apples. As he consumes one apple after another he derives less and less satisfaction. The first unit consumed with atmost pleasure. For the second, the intensity of his desire diminishes. The third will be still less and so on. The total utility increasing until the consumption of fourth unit of good but diminishing rate. Fifth unit of apple gives him maximum total utility. But marginal utility becomes zero. Further consumption of sixth unit TU diminishes and MU becomes negative.
The relationship between total utility and marginal utility is explained in the following three ways.
- When total utility increases at diminishing rate, marginal utility falls.
- When total utility is maximum, marginal utility becomes zero.
- When total utility decreases, marginal utility becomes negative.
This can be shown in the following diagram.
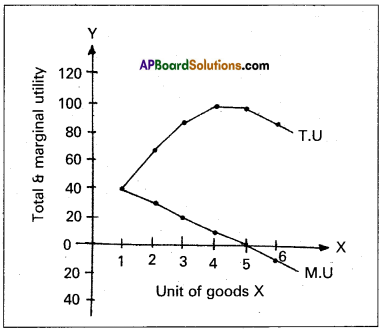
In the diagram on ‘X’ axis measures units of apples and OY axis measures total utility and marginal utility. TU curve represents total utility and MU curve represents marginal utility. TU curve is maxi¬mum at 5th unit where MU curve will become zero. TU curve slopes downwards from 6th unit, while MU will become negative.
Limitations or Exceptions :
- Hobbies:
This law does not operate in the case of hobbies like collection of stamps, old paintings, coins etc. Greater the collections of a person, greater is his satisfaction. Marginal utility will not diminish. - Drunkers:
It is pointed out that the consumption of liquor is not subject to the law of diminishing marginal utility. The more a person drinks liquor, the more he likes it. - Miser:
This law does not apply to money. The more money a person has the greater is the desire to acquire still more of it. - Further, this law does not hold good if any change in income of the consumer, tastes and preferences.
![]()
Question 2.
Explain the law of Variable Proportions.
Answer:
The law of variable proportions has been developed by the 19th century economists David Ricardo and Marshall. The law is associated with the names of these two economists. The law states that by increasing one variable factor and keeping other factors constant, how to change the level of output, total output first increases at increasing rate, then at a diminishing rate and later decreases. Hence this law is also known as the “Law of diminishing returns”.
Marshall stated in the following words. “An increase in capital and labour applied in the cultivation of land causes in general less than proportionate increase in the amount of produce raised, unless it happens to coincide with an improvement in the arts of agriculture”.
Assumptions :
- The state of technology remain constant.
- The analysis relates to short period.
- The law assumes labour in homogeneous.
- Input prices remain unchanged.
Explanation of the Law:
Suppose a farmer has ‘4’ acres of land he wants to increase output by increasing the number of labourers, keeping other factors constant. The changes in total production, aver¬age product and marginal product can be observed in the following table.
| Units of Variable factor | Total product | Average product | Marginal product | Stages of output |
| 1 | 50 | 50 | 50
60 |
(Ist stage)
Increasing returns |
| 2 | 110 | 55 | ||
| 3 | 135 | 45 | 25
15 |
(IInd stage)
Diminishing returns |
| 4 | 150 | 37.50 | ||
| 5 | 160 | 32 | 10
5 0 -5 |
(IIIrd ) stage
Negative returns |
| 6 | 165 | 27.50 | ||
| 7 | 165 | 23.5 | ||
| 8 | 160 | 20 |
In the above table total product refers to the total output produced per unit of time by all the labourers employed. Average product refers to the product per unit of labour marginal product refers to additional product obtained by employing an additional labour.
In the above table there are three stages of production.
1st stage i.e., increasing returns at 2 units total output increases average product increases and marginal product reaches maximum.
2nd stage i.e., diminishing returns from 3rd unit onwards TP increases diminishing rate and reaches maximum, MP becomes zero, AP continuously decreases.
3rd stage i.e., negative returns from 8th unit TP decreases AP declines and MP becomes negative. This can be explained in the above diagram.
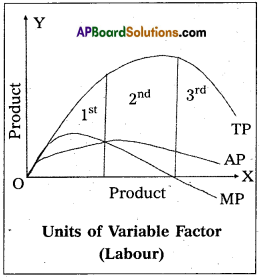
In the diagram on ‘OX’ axis shown units labourer and ‘OY’ axis show TP, MP, and A.P. 1st stage TP, AP increases MP is maximum. In the 2nd stage TP maximum, AP decrease MP is zero. At 3rd stage TP declines, AP also declines, MP becomes negative.
Question 3.
What is market? Explain the classification of markets.
Answer:
Market is commonly thought of as a place where commodities are bought and sold and where buyers and sellers meet. But in economics, the word market does not refer to any particular place. It refers to a region. “Market implies the whole area over which buyers and sellers are in such touch with each other, direction or through middlemen, that the price of the commodity in one part influences it in other parts of it”.
Classification of markets: Markets can be classified on the basis of
1) area covered,
2) time and
3) degree of competition.
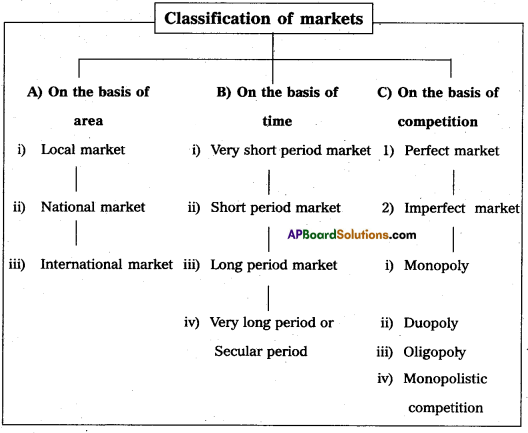
A) On the basis of area : On the basis of area the markets are classified into three.
1) Local market:
A product is said to have local market, when buyers and sellers of the product carry on the business in a particular locality. These goods are highly perishable cannot to take to distant places. They cannot even stored for a longer time. Ex : Vegetables, milk, fruits etc.
2) National market:
A national market is said to exist when a commodity is demanded and supplied all over our country. Generally the market of durable and industrial goods cover the entire nation. Ex : Wheat, sugar, cotton etc.
3) International market:
International market or world market exists when the buyers and sellers are spread all the world for a commodity. Ex : Gold, silver, diamonds etc.
B) On the basis of time : Marshall classified these markets into four categories.
1) Very short period market:
The supply is fixed in this market. It may be one day or two days. Perishable goods like fish, vegetables, flowers etc., do have only very short period market. There is no difference between supply and stock of the commodity.
2) Short period market:
This period is long enough only to change variable factors of production in changing the output. During this period supply can be changed only to some extent, but not totally for a given change in the demand.
3) Long period market:
The long period market is one which is long enough to change the supply totally for a given change in the demand. This period permits to change all the factors of production in changing output. Therefore all factors of production are variable.
4) Very long period or secular period:
This is the period in which the size of population, supplies of rawmaterials, lachs of people etc., would have enough time to change. There is enough time to introduce innovations. In this period changes take place even in the factors of production.
C) On the basis of nature of competition: On the basis of nature of competition, markets are classified into two :
1) Perfect market:
A market is said to be perfect when the competition exists when buyers and sellers are having perfect knowledge about the market conditions. They are large in number. There will only one price for a commodity through out the market etc.
2) Imperfect market:
A market is said to be imperfect when some buyers and sellers both are not aware of the offers being made by others. Buyers and sellers do not have perfect knowledge about the price in different places. Thus price is not uniform throughout the market. It differs from place to place and from seller to seller. Imperfect market can take several forms.
They are :
a) Monopoly,
b) Duopoly,
c) Oligopoly and
d) Monopolistic competitions.
a) Monopoly:
Monopoly means a single producer,. Where one producer supplies the commodity to the market. The product supplied by a monopolist will not have close substitutes in the market.
b) Duopoly:
Duopoly is one type of oligopoly market. There are only two producers in the market. They make decisions either independently or together.
c) Oligopoly:
Oligopoly is a market with a few producers. Each firm produces a considerable part of the output. Decisions of one firm affect the other firms.
d) Monopolistic competition:
It is a market where several firms produce a commodity with small differences. Firms advertise their goods to promote sales.
Question 4.
Explain the various methods of calculating National Income.
Answer:
There are three methods of measuring national income.
- Output method or Product method.
- Expenditure method.
- Income method.
‘Carin cross’ says national income can be looked in any one of the three ways. As the national income measured by adding up everybody’s income by adding up everybody’s output and by adding up the value of all things that people buy and adding in their savings.
1) Output method (Product method):
The market value of total goods and services produced in an economy in a year is considered for estimating National Income. In order to arrive at the value of the product services, the total goods and services produced are multiplied with their market prices.
Then National Income = (P1Q1 + P2Q2 + …. PnQn) – Depreciation – Indirect taxes + Net income from abroad.
Where P = Price
Q = Quantity
1,2, 3 ……. n = Commodities & services
There is a possibility of double counting. Care must be taken to avoid this. Only final goods and services are taken to compute National Income, but not the raw materials or intermediary goods. Estimation of the national income through this method will indicate the contribution of different sectors, the growth trends in each sector and the sectors which are lagging behind.
2) Expenditure method:
In this method we add the personal consumption expenditure of households, expenditure of the firms, government purchase of °oods and services net exports plus net income from abroad. NI = EH + EF + EG + Net exports + Net income from abroad.
Here National Income = Private final consumption expen¬diture + Government final consumption expenditure + Net domestic capital formation + Net exports + Net income from abroad.
EH = Expenditure of households
EF = Expenditure of firms
EG = Expenditure of government
Care should be taken to include spending or expenditure made on final goods and services only.
3) Income method:
In this method, the incomes earned by all factors of production are aggregated to arrive at the National Income of a country. The four factors of production receive incomes in the form of wages, rent, interest and profits. This is also national income at factor cost. NI = W + I + R + P + Net income from abroad NI = National income . W = Wages I = Interest R = Rent P = Profits
This method gives us National Income according to distribute shares.
Question 5.
Describe the various methods of redemption of public debt.
Answer:
Redemption of public debt means repayment of public debt. All government debts should be rapid promptly. There are various methods of repayment which may be discussed under the following heads.
- Surplus budget:
Surplus budget means having public revenue in excess of public expenditure. If the government plans for a surplus budget, the excess revenue ma – e utilized to repay public debt. 1 - Refunding:
Refunding implies the issue of fresh bands and securities by government so that the matured loans can be used for repayment of public debt. - Annuities:
By this method, the government repays past of the public debt every year. Such annual payments are made regularly till the debt is completely cleared. - Sinking fund:
By this method, the government creates a separate fund called ‘Sinking fund’ for the purpose of repaying public debt. This is considered as the best method of redemption. - Conversion:
Conversion means that the existing loans are changed into new loans before the date of their maturity. - Additional taxation:
Government may resort to additional taxation so as to raise necessary funds to repay public debt under this method new taxes are imposed. - Capital levy:
Capital levy is a heavy one time tax on the capital assets and estates. - Surplus Balance of payments:
This is useful to repay temal debt for which foreign exchange is required surplus balance of payment implies exports in excess of imports by which reserves of foreign exchange can be created.
Section – B
Note : Answer ANY THREE out of the following five twelve question (8 × 5 = 40)
Question 6.
Characteristics of wants.
Answer:
Wants are the starting point of all economic activities. As soda conditions improve, people prefer not only to satisfy their basic need but also to have comforts and luxuries. So if one want is satisfied, th other crops up. If there are no wants, there is no consumption, r production, no exchange, no distribution etc.
Characteristic features of human wants: Human wants are not uniform or similar. They differ from person to person, time to time and place to place. Wants are having the following characteristic features.
1) Wants are unlimited:
Human wants are unlimited. There is no end to human wants. When want is satisfied another want takes its place. A person who has no cycle would like to have it in the first instance, latter scooter, car etc.
2) A particular want is satiable:
Although a man cannot satisfy all his wants, a particular want can be satisfied completely in a period of time, It is possible because the intensity of wants is limited. Ex : Want for T.V can be satisfied by purchasing a T.V. An important law in economics known as the law of Diminishing Marginal Utility is based on this characteristic.
3) Wants are competitive:
Human wants are unlimited. But the means to satisfy them are limited of scarce. Hence it is possible for us to satisfy some wants only and leave the rest. So, every want completes with other to get
satisfied.
4) Wants are complementary:
To satisfy a particular want we need a group of commodities at the same time. In other words, satisfaction of a single want requires the simultaneous consumption of a number of commodities. Ex : To satisfy the want for coffee we need milk, sugar, decoction etc.
5) Wants are alternative:
Most of our wants can be satisfied ay different ways. For example : we can satisfy our hunger either by aking meal or bread or fruits or milk etc. Thus particular want can be atisfied by several alternatives.
6) Wants are recur:
Many of the human wants are recur. They ppear again and again although they satisfied completely in a articular time period. Ex: If we feel hungry, we take some food and satisfy this want. But after some time we shall again feel hungry.
7) Wants differ in urgency:
All our wants are not equally important or urgent. They differ greatly in intensity. Some wants are more urgent and other are less urgent.
Question 7.
Jacob Viner’s definition.
Answer:
Jacob Viner’s definition of economics is considered as modem definition of economics. He is an American economist known for his short ran and long ran cost curve analysis. According to Jacob Viner” Economics is what economists do”. The problem of the economy are.
- What to produce and in what quantities : The economy has to decide whether to produce consumer goods and capital goods. These decisions are influence by individuals as well as government.
- How to produce these goods : A decision has to be made whether to use labour intensive or capital intensive techniques.
- For whom to produce these goods and services : It is concerned with the distribution of income and wealth among different sections of the society.
- How efficient the productive resources are in use : This I refers to the efficiency of economic system.
- Whether the available resources are fully utilised : If resources are fully utilised that it can provide more employ¬. ment opportunities.
- Is the economy growing or static over a period of time.
Question 8.
Difference between cardinal and ordinal utility.
Answer:
The concept of utility was introduce by Benham in 1789. Utility means want satisfying power of a commodity. It is a psychological phe-nomenon. The measurement of utility, there are two different approaches.
1. Cardinal utility
2. Ordinal utility
1) Cardinal utility:
This approach was developed by Alfred Marshall. According to him utility is psychological concept. So it can be measured ‘util’. The numbers 1, 2, 3, 4 etc are cardinal numbers. According to this analysis the utilities derived from consumption of different commodities can be measured in terms of arbitary units, such as 1, 2, 3 … and soon.
2) Ordinal utility:
This approach was developed by R. J.D. Allen and J.R.Hicks. According to them utility is psychological concept. So we cannot measure in numerically much less compared. The num¬bers 1st, 2nd, 3rd, 4th etc., are ordinal numbers. The ordinal numbers are ranked. It means the utilities obtained by the consumer from dif¬ferent goods can be arranged in a serial order such as 1st, 2nd, 3rd, 4th etc.
Question 9.
What are the factors that determine demand?
Answer:
Demand function states the factors that determine the demand for a good. The following are the important factors :
1) Price of the good :
There is an inverse relationship between the quantity demanded and the price of the commodity. That is when the price falls; the demand for the good increases and the demand for the good decreases with a rise in the price of the good.
2) Consumer’s Income: It is obvious that income will influence the amount of most goods and services people will purchase at any given price. In,case of ‘normal’ goods the quantity demanded increases
with rise in income. But in the case of ‘inferior’ goods the quantity demanded at any price will fall with an increase in income. The idea is that the consumer generally goes in favour of better goods as soon as they can afford to.
3) Prices of substitutes and complementaries:
In case of substitutes there exists a direct or positive relationship between the price and quantity demanded. For example, goods like tea and coffee an increase in the price of one will tend to increase the demand for the other. In case of complementary goods there exists an inverse or negative relationship between the price and quantity demanded. For example, goods like car and petrol, the fall in price of cars will lead to an increase in the demand for petrol.
4) Changes in Tastes:
Not all people share the same tastes. Nor does taste always remain fixed over time. This includes changes in fashions, customs, habits etc. If the consumer acquires a taste for a particular, commodity, its demand is bound increase. For instance, the demand for a particular brand of soap increases due to the use of the same in an advertisement involving a famous film actor or actress.
Question 10.
Explain the Total Outlay Method of measuring elasticity of demand.
Answer:
This method was introduced by Alfred Marshall. Price elasticity of a demand can be measured on the basis of change in the total outlay dug to a change in the price of a commodity. This method helps us to compare the total expenditure from a buyers or total revenue from a seller before and after the
change in price.
Total outlay = Price × Quantity demanded
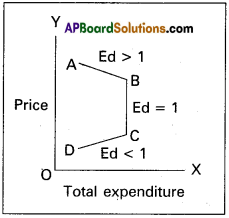
According to this method the price elasticity of demand is expressed in three forms, they are elastic demand, unitary elastic and in elastic demand. This can be explained with the help of table.
| Price | Quantity demand | Total expenditure or outlay | Ed nature |
| 6 | 100 | 600 | Elastic demand |
| 5 | 200 | 1000 | Ed > 1 |
| 4 | 300 | 1200 | Unitary demand |
| 3 | 400 | 1200 | Ed = 1 |
| 2 | 500 | 1000 | Inelastic demand |
| 1 | 600 | 600 | Ed < 1 |
In this table shows that:
- If the total expenditure increases due to a fall in price is known as relatively elastic demand.
- If total expenditure remains constant even the price falls is known as unitary elastic demand.
- If the total expenditure decreases due to a fall in price is known as relatively inelastic demand.
This can be shown in the following diagram.
In the diagram OX’ axis represents total expenditure and ‘OY’ axis represents price. The total outlay curve ‘AD’ is shown in three parts i.e., A to B; B to C; and C to D.
Question 11.
What are the factors that determine factor prices?
Answer:
The demand and supply of a factor of production determine its price. The demand for a factor of production depends on the following.
- It depends on the demand for the goods produced by it.
- Price of the factor determines its demand.
- Prices of other factors or co-operative factors determine the demand for a factor.
- Technological changes determine the demand for a factor.
- The demand for a factor increases due to increase in its production.
Factors that determine the supply of a factor of production.
- The size of the population and it’s age composition.
- Mobility of the factor of production.
- Efficiency of the factor of production.
- Geographical conditions.
- Wage also determines the supply of this factor.
- Income.
Question 12.
What are the factors that determine National Income.
Answer:
National Income is the total market value of all goods and services produced in a country during a given period of time. There are many factors that influence and determine the size of national income country.
a) Natural resources:
The availability of natural resources in a country, its climatic conditions, geographical features, fertility of soil, mines and fuel resources etc., influence the size of national income;
b) Quality and Quantity of factors of production:
The national income of a country is largely influenced by the quality and quantity of a country’s stock of factors of production.
c) State of technology:
Output and national income are influenced by the level of technical progress achieved by the country. Advanced techniques of production help in optimum utilization of a country’s national resources.
d) Political will and stability:
Political will and stability in a country helps in planned economic development and for a faster growth of national income.
Question 13.
Explain the wage cut policy.
Answer:
Wage cut policy is one of the assumption of classical theory of employment which was started by “AC Pigou” who defended the clas¬sical theory and its full employment assumption. To Pigou and others the wage fund is given. The wage rate determined by dividing the wage fund with the number of workers. Pigou advocated a general cut in money wages in times of depression to restore full employment.
If there is a problem of unemployment in the economy. It is possible to solve this problem by reducing the money wages of the workers. This is known as “wage cut policy”. The given wage fund can offer more employment at a lower wage rate. The classicals believe that involuntary unemployment all involuntary unemployment would disappear.
According to classical theory of the labour .supply and its demand depends on real wage rate. Real wage rate indicates the purchasing power of labourers. Because of existence of perfect competition in labour market real wage rate always equals to marginal productivity of labour. Labour supply is positively related to real wage rate and the demand for labour is inversely related to real wage rate.
Question 14.
List out various items of public expenditure.
Answer:
Public expenditure is an important cpnstituent of public finance. Modern governments spend money from various welfare activities. The expenditure incurred by the government on various economic activities is called public expenditure. Governments incurr expenditure on the following heads of accounts.
- Defence
- Internal security
- Economic services
- Social services
- Other general services
- Pensions
- Subsidies
- Grants to state governments
- Grants to foreign governments
- Loans to state governments
- Loans to public enterprises
- Loans to foreign governments
- Repayment of loans
- Assistance to states on natural calamities etc.
Question 15.
Write a note on Reserve Bank of India.
Answer:
Reserve Bank of India is the central bank of India. It was established in April 1935, with a share capital of ₹ 5 crores. It was originally owned by private shareholders and was nationalised by the government of India in 1949. It performs all the functions of central bank according to the “Reserve Bank of India Act 1934”.
The main objectives of Reserve Bank of India are :
- Regulating the issue of currency notes.
- Providing guidance to the commercial banks.
- Controlling the credit system of the economy.
- Achieving the monetary stability in the economy.
- Implementing the uniform credit policy throughout the country.
Question 16.
Enumerate the measures to control inflation.
Answer:
To control the inflation the government has taken various steps. They are :
- Increase the production in the long run.
- Implementing proper monetary and fiscal policies to reduce the supply of money and credit.
- Controlling prices and eliminating black markets.
- Importing the goods which are scares in supply from outside countries.
- Introducing rationing and quota system in case of man consumption of goods.
- Distribution of goods to all the needy sections of the people.
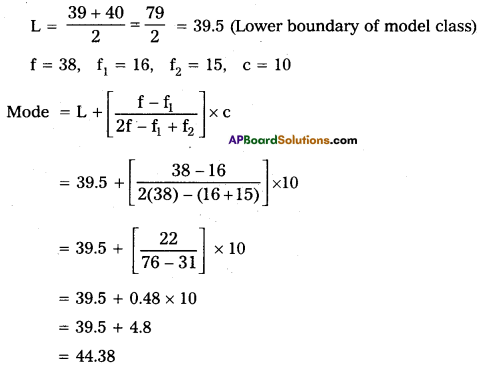
Question 17.
Calculate Mode for the following data :
| Class Interval | Frequency |
| 20 – 29 | 15 |
| 30 – 39 | 16 |
| 40 – 49 | 38 |
| 50 – 59 | 15 |
| 60 – 69 | 9 |
| 70 – 79 | 7 |
Answer:
| C.I | ‘f’ |
| 20 – 29 | 15 |
| 30 – 39 | 16 f1 |
| 40 – 49 | 38 f |
| 50 – 59 | 15 f2 |
| 50 – 69 | 9 |
| 70 – 79 | 7 |
Here maximum frequency occurs in 40 – 49 class.
Section – C
Note : Answer ANY EIGHT out of the following twelve question (15 × 2 = 30)
Question 18.
Intermediary goods.
Answer:
Goods which are under the prpcess of production and semi finished goods are known as intermediary goods. Ex: Cotton and fibre etc.
Question 19.
Utility.
Answer:
Utility has great significance in the study of economics. It means the want satisfying power of a commodity. It is a subjective concept. No one can measure or estimate it in mathematical terms. Utility is of four types namely Form utility, Time utility, Place utility and Service utility.
Question 20.
Price line.
Answer:
It shows all possible combinations of two goods that a consumer can buy, with the given income of the consumer’s and prices of the two goods.
Question 21.
Individual demand schedule.
Answer:
Individual demand schedule explains the relationship between various quantities purchased at various prices by a single consumer in the market.
Question 22.
Giffen paradox.
Answer:
It means necessary goods Sir Robert Giffen in mid 19th century observed that the low paid workers in England purchased more bread when its price increase by decrease in the purchase of meat. The increase in demand for bread when price increased is an exception to the law of demand, it is known as Giffen’s paradox.
Question 23.
Production function.
Answer:
The production function is the none for the relation between the physical inputs and the physical outputs of a film. Production of a firm, production function explains the functional relationship between inputs and outputs. This can be as follows.
Gx – f(L,K,R,N,T)
Question 24.
Price discrimination.
Answer:
Monopolist will charge different prices for the same commodity or service in the market. This is known as discriminating monopoly or price discrimination.
Question 25.
Selling costs.
Answer:
An important feature of monopolistic market is every firm makes expenditure to sell more output. Advertisements through newspapers, journals, electronic media etc., these methods are used to attract more consumers by each firm.
Question 26.
Real wages.
Answer:
The amount of goods and services that can be purchased with the money wages at any particular time is called real wage. Thus real wage is the amount of purchasing power received by worker through his money wage. Real wage, as such depends on two factors : (1) Amount of money wage and (2) The price level. The real wage can be measured as follows.
where R = Real wage,
W = Money wage
P = Price level.
Real wages are considered to be the best index of measuring the economic welfare of the workers.
Question 27.
Net profit.
Answer:
Net profit is the economic profit of pure business profit. Net profit is the residue obtained by deduction explicit and implicit cost from the total revenue of a firm.
Question 28.
Per capita income.
Answer:
It is the average income received by a citizen of a country in a year. We arrive at per capita income by dividing the national income with the population of a country.
Question 29.
Say’s law of market.
Answer:
J.B. Say a french economist advocated the famous “Law of Market’s” on which the classical theory of employment is based. According to this law “Supply creates its own demand”. According to this law whenever additional output is created the factors of production which participate in that production receive incomes equal to that value of that output. This income would be spent either on consumption goods or on capital goods. Thus additional demand is created matching the additional supply.
Question 30.
Fiscal deficit.
Answer:
Fiscal deficit is the difference between total revenue and total expenditure plus the market borrowings. Fiscal deficit = [Total revenue – Total expenditure] + other borrowing and other liabilities.
Question 31.
Near money.
Answer:
The near money refers to those highly liquid assets which are not accepted as money but then can be easily converted into money within a short period. Ex : Saving bank deposit, shares, treasury bills, bonds etc.
Question 32.
Overdraft.
Answer:
Over draft is permissable on current account only. The current account holders are given the facility of overdrafts by which they are allowed to draw on amount above their balances. However they can overdraw the amount upto a certain limit fixed by the bank.
Question 33.
Store of value.
Answer:
Store of value: The value of commodities and service can be stored in the form of more. Certain commodities are perishable. If they are exchanged for money before they perish, their value be preserved in the form of money.
Question 34.
Hyper inflation.
Answer:
Hyper inflation is also known as galloping inflation. If the inflation rate exceeds 10% per annum is called Hyper inflation. The rate of inflation may go upto 100% or even more. This is highly dangerous and totally upsets the economy.
Question 35.
What is meant by Arithmetic Mean?
Answer:
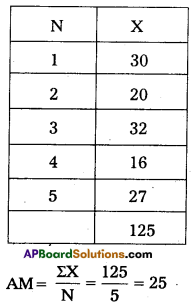
Arithmetic mean of a statistical data is defined as the quotient of the sum of all the items or entries divided by the number of items.
Question 36.
What is a pie diagram?
Answer:
It is also called a pie chart. The circle is divided into many parts as there are components by drawing straight lines from the centre to the circumference.
Question 37.
Find out the A.M. for the data 30, 20, 32, 16, 27
Answer: