The strategic use of AP Inter 1st Year Economics Model Papers and AP Inter 1st Year Economics Question Paper March 2018 allows students to focus on weaker areas for improvement.
AP Inter 1st Year Economics Question Paper March 2018
Note : Read the following instructions carefully :
- Answer ALL the questions as per the choice specified. Draw suitable diagrams wherever necessary.
- Questions from Serial Nos. 1 to 5 in Section ‘A’ are of Long Answer Type. Each question carries TEN marks. ANY THREE questions j may be answered out of five given questions. Every answer may he limited to 40 lines.
- Questions from Serial Nos. 6 to 17 in Section ‘B’ are of Short Answer Type. Each question carries FIVE marks. ANY EIGHT questions may be answered out of twelve given questions. Every answer may be limited to 20 fines.
- Questions from Serial Nos. 18 to 37 in Section ‘C’ are of Very Short Answer Type. Each question carries TWO marks. ANY FIFTEEN questions may be answered out of twenty given questions. Every answer may be limited to 5 fines.
Section – A
Note : Answer ANY THREE out of the following five questions. (3 × 10 = 30)
Question 1.
Explain consumer equilibrium with law of equi-marginal utility.
Answer:
Law of equi-marginal utility is an important law of consumption. It is called as “Gossen’s with the name of H.H.Gossen. According to Marshall “If person has a thing which can be put to several uses, he will distribute it among these uses in such a way that it has the same marginal utility in all uses. If it had a greater marginal utility in one use than in another, he would gain by taking away some of it from the second and applying it to the first”.
According to this law the consumer has to distribute his money income on different uses in such a manner that the last rupee spent on each commodity gives him the same marginal util¬ity. Equalisation of marginal utility in different uses will maximise his total satisfaction. Hence this law is known as “law of equi-marginal utility”.
Assumptions of the law : The law of equi-marginal utility depends on the following assumptions.
- This law is based on cardinal measurement of utility.
- Consumer is a national man always aiming at maximum satisfaction.
- The marginal utility of money remains constant.
- Consumer’s income is limited and he is proposed to spent the entire amount on different goods.
- The price of goods are unchanged.
- Utility derived from one commodity is independent of the utility of the other commodity.
The fundamental condition for consumer’s equilibrium can be explained in the following way.
\(\frac{\mathrm{MU}_{\mathrm{x}}}{\mathrm{P}_{\mathrm{x}}}=\frac{\mathrm{MU}_{\mathrm{y}}}{\mathrm{P}_{\mathrm{y}}}=\frac{\mathrm{MU}_{\mathrm{z}}}{\mathrm{P}_{\mathrm{z}}}\) = MUm
Where MUx, MUy, MUz, MUm = marginal utility of commodities X, Y, Z, m;
px Py, Pz = prices of x, y, z.
This law can be explained with the help of a table. Suppose the consumer is prepared to spend his money income is ₹ 26/- on two goods x and y. Market prices of two goods are ₹ 4/- & ₹ 5/- respectively. Now the marginal utilities of goods x & y are shown below.
| Units Ux | MUx | Units Uy | MUy |
| 1 | 44 | 1 | 45 |
| 2 | 40 | 2 | 40 |
| 3 | 36 | 3 | 35 |
| 4 | 32 | 4 | 30 |
| 5 | 28 | 5 | 25 |
For explaining consumer’s maximum satisfaction and conse-quent equilibrum position we need to reconstruct the above table by dividing marginal utilities of x its price ₹ 4/- and marginal utility of y by ₹ 5/-. This is shown in the following table.
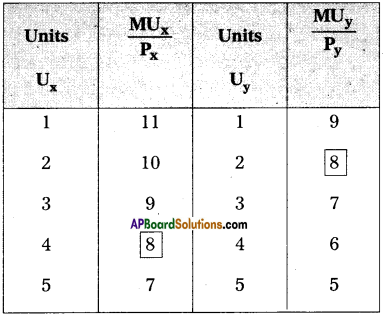
In the table it is clear that when consumer purchase 4 units of goods x & 2 units of good y. Therefore, consumer will be in equilibrium when he is spending (4 × 4 = 16 + 2 × 5 = 10) ₹ 26 on them.
Consumer’s equilibrium may be shown in the diagram.
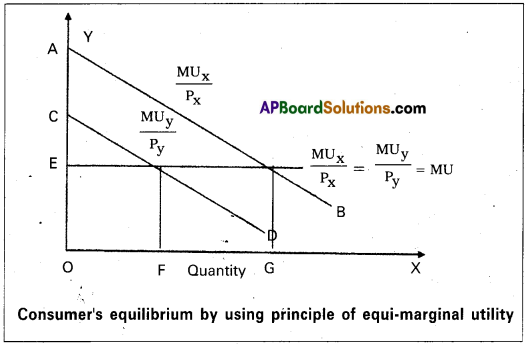
In the diagram marginal utility curves of goods slope down-wards i.e. AB & CD taking the income of the consumer as given, suppose his Mu of money constant at OE.\(\frac{\mathrm{MU}_{\mathrm{x}}}{\mathrm{P}_{\mathrm{x}}}\) is equal to OE
when OG quantity of good X is brought. \(\frac{\mathrm{MU}_{\mathrm{y}}}{\mathrm{P}_{\mathrm{y}}}\) is equal to OE,
- when OF quantity of good y is purchased. Thus consumer purchasing OG of X and OF of Y. \(\frac{M U_x}{P_x}=\frac{M U_y}{P_y}\) = MUm This is consumer’s equilibrium.
![]()
Question 2.
Explain the law of variable proportions.
Answer:
The law of variable proportions is also known as the Law of diminishing marginal returns. Economists like Ricardo, Malthus, Marshall gave more importance to this law and propounded their theories by keeping this law as basis. The law of variable propor-tions refers to the short-run. According to the classicals and Marshall, this law is applicable to the agricultural sector only. But the modem economists hold that the law is applicable to all the sectors.
The law of variable proportions explains the changes in output when a factor of production is varied while keeping other factors constant in the short period. The law states that if more and more units of variable input is applied to a given quantity of fixed inputs, the total output may initially increases at an increasing rate but beyond a certain level, the rate of increase in the total output diminishes.
According to ‘Marshall’ :
“An increase in the amount of labour and capital applied in the cultivation of land causes in general, a less than proportionate increase in the amount of output raised unless it happens to coincide with an improvement in the arts of agriculture
According to ‘Benham’ :
“As the proportion of one factor in a combination of factors is increased, after a certain point. First the marginal and then the average product of that factor will diminish .
Assumptions of the law :
- The state of technology remains unchanged.
- Input prices remain unchanged.
- It is possible to vary the proportions in which the various inputs are combined.
- All units of the variable factors are homogeneous.
- It is assumed that the entire operations belongs to short period.
- The product should be measured in physical units.
Explanation of the law:
Let us illustrate the law with the help of table where on the fixed units of land of two acres, units of variable factor are employed keeping other factors constant. The changes in total product, average product and marginal product can be observed in the following schedule.
| Variable factor (labour) | Total product(quintals) | Average product (quintals) | Marginal product (quintals) | |
| 1 | 3 | 3 | 3 | Stages
I Increasing returns to stage |
| 2 | 7 | 3.5 | 4 | |
| 3 | 12 | 4 | 5 | |
| 4 | 16 | 4 | 4 | |
| 5 | 19 | 3.8 | 3 | II
Diminishing returns stage |
| 6 | 21 | 3.5 | 2 | |
| 7 | 22 | 3.1 | 1 | |
| 8 | 22 | 2.8 | 0 | III
Negative returns stage |
| 9 | 21 | 2.3 | -1 | |
| 10 | 19 | 1.9 | -2 |
Total production:
Sum of the marginal productions is called total production. Total product refers to the total output produced per unit of time by all the labours employed.
Average production:
It refers to the product per unit of labour. If total product is divided by the number of labourers employed we get average product.
Marginal product:
It is the additional product obtained by employing an additional labour.
Marginal product = \(\frac{\Delta \mathrm{TP}}{\Delta \mathrm{L}} \text { i.e., } \frac{\text { Change in total output }}{\text { Change in labour }}\)
Increasing returns:
In the above table total production increasing at increasing rate upto the 4th labourer then the average and marginal production also increasing. At the 4th labourer the average product (4 units) is equal to the marginal product (4 units). This is the ’First stage’ which is known as the stage of ‘Increasing returns’.
Diminishing returns:
In this stage total production increasing at diminishing rate and becomes to maximum then the average production and marginal productions are diminishing. In the above table at the 8th labourer total production reaches to maximum (22 units) and marginal production becomes to zero. This is the ‘second stage’ which is known as the stage of diminishing returns.
Negative returns:
In this stage total production diminishing positively, average production also but marginal production becomes negative. This is the third stage which is known as the ‘Stage of Negative Returns’. Let us illustrate the law with the help of a diagram.
In the diagram TP, MP and AP curves inverse, at first reach heir maximum and then start declining. The first stage relates to increasing,return stage. When more units of labour are applied to a fixed factor, the fixed factor is used more intensively and productivity increases rapidly. This stage is shown in the diagram
from O to C. TP, AP and MP are increasing is noted in this stage. A rational producer will not stop his production in this stage. In the third stage marginal product becomes zero and negative. A rational producer will not undertake production in this stage. This stage starts from point ‘N’. These two stages will not feasable and profitable. Therefore, production will always take place in the second stage but not at the end of the IInd stage because, the MP is equal to zero.
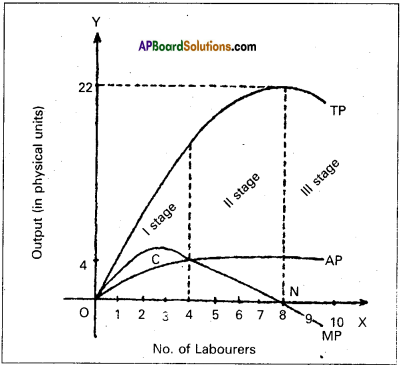
In the I stage MP curve first rises and start falling after reaching maximum. In the II stage AP starts falling. MP and AP are falling but TP is still rising. In the III stage TP, AP and MP are all falling but MP becomes negative.
Importance of the law:
This law has several theoretical and practical usages.
- This law is the basis for Malthus population theory of population.
- It is the basis of Ricardian theory of rent.
- It Helps to agricultural sector.
- It helps to industrial sector for taking decisions.
![]()
Question 3.
Explain the classification of markets.
Answer:
Market is commonly thought of as a place where commodi¬ties are bought and sold and where buyers and sellers meet. But in economics, the word market does not refer to any particular place. It refers to a region. “Market implies the whole area over which buyers and sellers are in such touch with each other, direction or through middlemen, that the price of the commodity in one part influences it in other parts of it”.
Classification of markets:
Markets can be classified on the basis of
1) area covered,
2) time and
3) degree of competition.
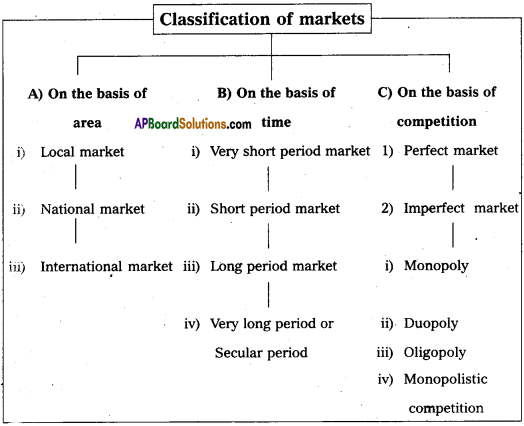
A) On the basis of area: On the basis of area the markets classified into three.
i) Local market:
A product is said to have local market, when buyers and sellers of the product carry on the business in a particular locality. These goods are highly perishable cannot to take to distant places. They cannot even stored for a longer time. Ex : Vegetables, milk, fruits etc.
- National market:
A national market is said to exist when a commodity is demanded and supplied all over our country. Generally the market of durable and industrial goods cover the entire nation. Ex : Wheat, sugar, cotton etc. - International market:
International market or world market exists when the buyers and sellers are spread all the world for a commodity. Ex : Gold, silver, diamonds etc.
B) On the basis of time : Marshall classified these markets into four categories.
- Very short period market:
The supply is fixed in this market. It may be one day or two days. Perishable goods like fish, vegetables, flowers etc., do have only very short period market. There is no difference between supply and stock of the commodity. - Short period market:
This period is long enough only to change variable factors of production in changing the output. During this period supply can be changed only to some extent, but not totally for a given change in the demand. - Long period market:
The long period market is one which is long enough to change the supply totally for a given change in the demand. This period permits to change all the factors of production in changing output. Therefore all factors of production are variable. - Very long period or secular period:
This is the period in which the size of population, supplies of rawmaterials, lachs of people etc., would have enough time to change. There is enough time to introduce innovations. In this period changes take place even in the factors of production.
C) On the basis of nature of competition : On the basis of nature of competition, markets are classified into two :
- Perfect market:
A market is said to be perfect when the competition exists when buyers and sellers are having perfect knowledge about the market conditions. They are large in number. There will only one price for a commodity through out the market etc. - Imperfect market:
A market is said to be imperfect when some buyers and sellers both are not aware of the offers being made by others. Buyers and sellers do not have perfect knowledge about the price in different places. Thus price is not uniform throughout the market. It differs from place to place and from seller to seller. Imperfect market can take several forms.
They are :
a) Monopoly,
b) Duopoly,
c) Oligopoly and
d) Monopolistic competitions.
a) Monopoly :
Monopoly means a single producer,. Where one producer supplies the commodity to the market. The product supplied by a monopolist will not have close substitutes in the market.
b) Duopoly:
Duopoly is one type of oligopoly market. There are only two producers in the market. They make decisions either independently or together.
c) Oligopoly:
Oligopoly is a market with a few producers. s Each firm produces a considerable part of the output. Decisions of one firm affect the other firms.
d) Monopolistic competition:
It is a market where several firms produce a commodity with small differences. Firms advertise their goods to promote sales.
Question 4.
Explain the various methods of calculating National Income.
Answer:
The concept of National Income did not receive much atten-tion from the economists until the great economic depression of thirties. National Income is determined by the volume of employment. J.M. Keynes brought out the importance of National Income and employment in economic theory to achieve rapid economic development. The study of National Income is important.”National Income or National dividend is the flow of goods and services produced and made available to the people in a country in a year”.
National Income may be interpreted in three ways :
- The total value of output in a country in a year,
- The total value of all incomes received by the owners of factors of production in a year,
- The total expenditure incurred on all goods and services in a year.
According to ‘Marshall’ :
“The labour and capital of a country, acting upon its natural resources produce annually a certain net aggregate of commodities, material and immaterial including services of all kinds.
According to ‘Pigou’ : “The national dividend is that part of the objective income of the community including of course, income derived from abroad which can be measured in money”.
According to ‘Irving Fisher’ : “The National dividend or income consists solely of services as received by ultimate consumers : whether from their material or from their human environments”. Methods of measuring National Income : There are three methods of measuring National Income. They are
- Net output method or Value added method,
- Income method and
- Expen-diture method.
1. Product Method or Output Method: GNP is total value of final goods and services produced in a year. The final goods are valued at market prices, whether sold or added on inventories. Gross National Product (GNP) is always stated in money term. No item should be counted twice. To avoid double counting we exclude raw materials and intermediate goods. Ex: We include the value of bread only but not include the value of flour which used to make bread.
2. Income Received or Income Method : We added the income received by individuals and other for the services rendered by them in production. The total incomes of the factors of production put together is the National Income. The following precautions are to be taken, in estimating National Income.
- Exclude all transfer payments like old age pensions, interests etc.
- Exclude all illegal incomes and wind fall gains.
- Value of production for self-consumption and imputed rent of owner occupied houses.
- Incomes divided from the sale of second hand goods shall not be included.
- We should not count any income twice. Ex : The profits distributed by companies will be included in incomes of the shareholders. So it shall not be included in the incomes of companies.
3. Expenditure Method : This process of adding up expen diture on all final goods is called the expenditure approach. The Gross National Product is divided into four component parts ; according to who buys the goods and services,
- Goods and services bought by consumers;
- Investment goods purchased by business houses;
- A combination of consumer and investment goods purchased by government and
- Net exports (Value of exports minus value of imports) to foreign countries. It is the aggregate value of current production of goods and services flowing to the consumer business houses, government and foreign countries.
Question 5.
Explain the Keynesian theory of Employment.
Answer:
Keynesian theory of employment is the principle of effective demand^ He called his theory, general theory because it deals with all levels of employment. Keynes explains that lack of aggregate demand is the cause of unemployment. He used the terms aggre-gate demand, aggregate supply. It means total. The term effective demand is used to denote that level of aggregate demand which is equal to aggregate supply.
According to Keynes where aggregate demand and aggregate supply are intersected at that point effective demand is determined. This effective demand will determine the level of employment. Aggregate supply schedule: The aggregate supply schedule shows the various amounts of the commodity that will be offered for sale at a series of price. As the level of output increases with the level of employment. The aggregate supply price also increases with every increase in the level of employment. The aggregate supply curve slopes upwards from left to right. But when the economy aches the level of the full employment, the aggregate supply curve ;comes vertical.
Aggregate demand schedule:
The various aggregate demand prices at different level of employment is called aggregate demand price schedule. As the level of employment rises, the total income if the community also rises and therefore the aggregate demand nice also increases. The aggregate demand curve slopes upward rom left to right.
Equilibrium level of income :
The two determinants of effective demand aggregate supply and aggregate demand prices combined schedule shown in the following table.
| Level of employment (in lakhs of workers) | Aggregate supply price (in crores of ₹) | Aggregate demand price (in crores of ₹) |
| 20 | 200 | 175 |
| 30 | 250 | 225 |
| 40 | 300 | 300 AD = AS |
| 50 | 350 | 325 |
| 60 | 400 | 425 |
The table shows that so long as the demand price is higher than the aggregate supply price. The level of employment 40 lakh workers aggregate demand price is equal to aggregate supply price i.e., 300 crores. So effective demand in the above table is ₹ 300 crores. This can be shown in the following diagrams.
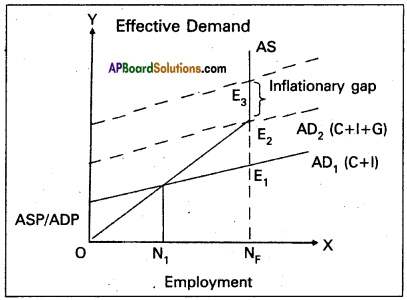
In the diagram ‘X’ axis represents the employment and 1 axis represents price. AS is aggregate supply curve AD is aggregaf demand curve. The point of intersection between the two ‘E1‘ an ‘E2‘. points. This is effective demand where all workers are employed at this point the entrepreneurs expectation of profits are maximised. At any other points the entrepreneurs will either incur losses or earn sub-normal profits.
Section – B
Note : Answer ANY THREE out of the following five twelve question (8 × 5 = 40)
Question 6.
Explain any five characteristics of wants.
Answer:
Wants are the starting point of all economic activities. As social conditions improve, people prefer not only to satisfy their basic needs but also to have comforts and luxuries. So if one want is satisfied, the other crops up. If there are no wants, there is no consumption, no production, no exchange, no distribution etc.
Characteristic features of human wants: Human wants are not uniform or similar. They differ from person to person, time to time and place to place. Wants are having the following characteri-stic features.
1) Wants are unlimited: Human wants are unlimited. There is no end to human wants. When want is satisfied another want takes its place. A person who has no cycle would like to have it in the first instance, latter scooter, car etc.
2) A particular want is satiable:
Although a man cannot satisfy all his wants, a particular want can be satisfied completely in a period of time. It is possible because the intensify of wants is limited. Ex : Want for T.V can be satisfied by purchasing a T.V An important law in economics known as the law of Diminishing Marginal Utility is based on this characteristic.
3) Wants are competitive: Human wants are unlimited. But the means to satisfy them are limited of scarce. Hence it is possible for us to satisfy some wants only and leave the rest. So, every want completes with other to get satisfied.
4) Wants are complementary: To satisfy a particular want we need a group of commodities at the same time. In other words,satisfaction of a single want requires the simultaneous consumption of a number of commodities. Ex: To satisfy the want for coffee we need milk, sugar, decoction etc.
5) Wants are alternative:
Most of our wants can be satisfied by different ways. For example : we can satisfy our hunger either by taking meal or bread or fruits or milk etc. Thus particular want can be satisfied by several alternatives.
6) Wants are recur:
Many of the human wants are recur. They appear again and again although they satisfied completely in a particular time period. Ex : If we feel hungry, we take some food and satisfy this want. But after some time we shall again feel hungry.
7) Wants differ in urgency:
All our wants are not equally important or urgent. They differ greatly in intensity. Some wants are more urgent and other are less urgent.
Question 7.
Write Jacob Viner definition of Economics.
Answer:
Jacob Viner’s definition of economics is considered as modem definition of economics. He is an American economist known for his short run and long run cost curve analysis. According to Jacob Viner” Economics is what economists do”. The problem of the economy are.
- What to produce and in what quantities : The economy has to decide whether to produce consumer goods and capital goods. These decisions are influence by individuals as well as government.
- How to produce these goods : A decision has to be made whether to use labour intensive or capital intensive techniques.
- For whom to produce these goods and services : It is concerned with the distribution of income and wealth among different sections of the society.
- How efficient the productive resources are in use : This refers to the efficiency of economic system.
- Whether the available resources are fully utilised : If resources are fully utilised that it can provide more employment opportunities.
- Is the economy growing or static over a period of time.
Question 8.
Write the properties of Indifference curves.
Answer:
Indifference curve shows the various combinations of two commodities which yield equal utility or satisfaction to the consumer.
Indifference schedule:
According to A.L. Meyers “An indifference schedule may be defined as schedule of various combinations of goods that will be equally satisfactory to the individual concerned”. This can be explained with the help of a table and diagram.
| Combinations | Number of x | Number of y |
| A | 1 | 20 |
| B | 2 | 15 |
| C | 3 | 11 |
| D | 4 | 8 |
| E | 5 | 6 |
| F | 6 | 5 |
In the above schedule the consumer gets as much total satisfaction from combination A and as well as from other combinations B, C, D, E and F, the total satisfaction is seem in all these combinations. Since consumer get same satisfaction he is indifferent to select any one of the combinations. Therefore this may be called “weak ordering”.
Indifference curve: With the help of the above table we can draw an indifferent curve to study its properties. In the side diagram ‘X’ good are shown on ‘OX’ axis ; and Y good shown on ‘OY’ axis.
IC is the indifferent curve. A, B, C, D, E, and, F are the various combinations of X and Y. The points on indifference curves give the consumer the equal level of satisfaction of various points is the same that is A = B = C = D = E = F.
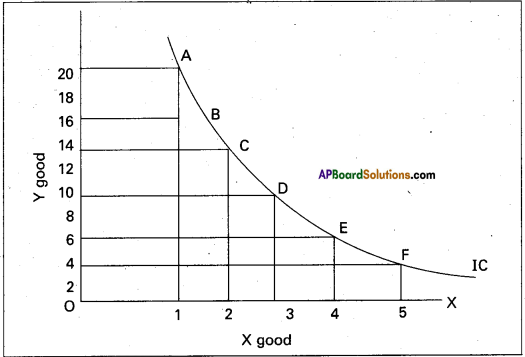
Properties of indifference curves: The important properties of Indifference curve are :
- Indifference curves slopes downwards from left to right there exists negative slope.
- Higher indifference curve represent higher levels of satisfaction. Indifference curve to the right represents high satisfaction.
- The indifference curves can never meet or intersect each other.
- The indifference curves are convex to the origin.
- Indifference curves need not be parallel to each other.
Question 9.
Why a demand curve has a negative slope or why demand curve slopes downwards?
Answer:
According to Marshall “The amount demanded increases with a fall in price and diminishes with a rise in price when other things repiain the same”.
The law of demand explains inverse relationship between the price and quantity demanded of a commodity. Therefore the demand curve slopes downward from left to right. There are some other reasons also responsible for downward slop Demand ing demand curve.
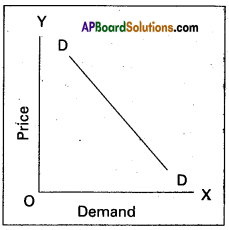
1) Old and new buyers:
If the price of a good falls, the real income of the old buyers will increase. Hence the demand for the good will increase. In the same way, the fall in price attracts new buyers and will be able to built after a fall in its price. So the de-mand curve slopes downwards from left to right.
2) Income effect:
Fall in price of commodity the real income of its consumers increase. The increase in real income encourages demand for the commodity with reduced price. The increase in demand on account of increased in real income is known as income effect.
3) Substitution effect:
When the price of commodity falls, it will become relatively cheaper than its substitutes. The increase in demand on account of increased in real income is known as in¬come effect.
4) Law of diminishing marginal utility:
According to this law, if consumer goes on consuming more units of the commodity, the additional utility goes on diminishing. Therefore, the consumer prefers to buy at a lower price. As a result the demand curve has a negative slope.
Question 10.
What are the factors that determine demand?
Answer:
The law of demand explaining the functional relation between price and demand. There are several factors which determine demand.
Factors of demand:
- Price of commodity: The demand for any good depends on its price, more will be demanded at lower price and vice-versa.
- Prices of substitutes and complementaries : Demand is influenced by changes in price of related goods either substitutes or complementary goods. Ex : Increase in the price of coffee leads an increase in the demand for tea in the case of substitutes positive relation and complementaries negative relationship between price and demand.
- Income of the consumer: Demand always changes with a change in the incomes of the people. When income increases the demand for several commodities increases and vice-versa.
- Population: A change in the size and composition of population will effect the demand for certain goods like food grains, clothes etc.
- Taste and preferences : A change in the taste and the fashions bring about a change in the demand for a commodity.
- Technological changes : Due to economic progress tech-nological changes the quantity the quality of goods available to the consumers increase. Ex: Demand for cell phones reduced the demand for landline phones.
- Change in the weather : Demand for commodity may change due to change in a climatic condition.
Ex : During summer demand for cool drinks, in winter de-mand for wollen clothes. - State of business : During the period of prosperity demand for commodities will expand and during depression demand will contract.
Question 11.
Explain the concept of quasirent.
Answer:
Marshall explained the concept of scarcity of rent on the basis of demand and supply. In general land has indirect demand or derived demand. If there is an explosion of population demand for land increases this result rise in its price. The surplus earned by land above its price is called scarcity rent. The supply of land is fixed and inelastic. The demand for land will determine the rent by influencing its price. Hence rent arises due to the scarcity in the supply of factors of production.
In the side diagram on ‘OX’ axis represent supply and demand for land. ‘OY’ axis represents Rent.
SL is supply of land. It is perfectly inelastic when ‘DD’ curve shifts upward to D1 D1. So price increases from OR to OR1. Similarly if demand curve further shifts from D1D1 to D2D2 rent price further increases from OR1 to OR2
Question 12.
What is National Income at Factor Cost?
Answer:
National Income means the aggregate value of all the final goods and services produced in the economy in one year.
National Income at factor cost: The cost of production of a good is equal to the rewards paid to the factors which participated in the production process. So the cost of production of a firm is the rent paid land, wages paid labour, interest paid on capital and profits of the entrepreneur.
National Income at factor cost = NNP + Subsidies Indirect Taxes – Profits of Govt, owned firms.
Question 13.
“Supply creates its own demand” comment on the statement.
Answer:
Classical theory of employment or the theory of output and employment developed by economists such as Adam Smith, David Ricardo, Robert Malthus etc., it is based on the J.B Say’s law of market’. According to this law “supply creates its own demand”. The classical theory of employment assumes that there is always full employment of labour and other resources.
According to this law the supply always equal to demand it can be expressed as S = D. Whenever additional output is pro¬duced in the economy. The factors of production which participate in the process of production. Earn income in the form of rent, wages, interest and profits. The total income so generated is equivalent to the total value of the additional output produced. Such income creates addition demand necessary for the sale of the additional output. Therefore the question of addition output not being sold does not arise.
Question 14.
What are the sources of Public revenue?
Answer:
Revenue received by the government from different sources is called public revenue.
Public revenue is classified into two kinds.
1) Tax revenue
2) Non-Tax revenue.
1) Tax Revenue: Revenue received through collection of taxes from the public is called tax revenue. Both the state and cen-tral government collect taxes as per their allocation in the consti-tution.
Taxes are two types.
a) Direct taxes:
- Taxes on income and expenditure.
Ex : Income tax, Corporate tax etc. - Taxes on property and capital assests.
A Ex : Wealth tax, Gift tax etc.
b) Indirect taxes : Taxes levied on goods and services.
Ex : Excise duty, Service tax.
2) Non – tax revenue:
Government receives revenue from sources other than taxes and such revenue is called non-tax revenue. They are :
a) Administrative revenue: Government receives money for certain administrative services. Ex : License fee, Tution fee etc.
b) Commercial revenue:
Modern governments establish public sector units to manufacture certain goods and of-fer certain services. The goods and services are exchanged for the price. So such units earn revenue by way of selling their products. Ex : Indian Oil Corporation, Bharath Sanchar Nigam Ltd, Bharath Heavy Electricals, Indian Railways, State Road Transport Corporations, Indian Air lines etc.,
c) Loans and advances
: When the revenue received by the government from taxes and from the above non-tax sources is not sufficient to meet the needs of government expenditure, it may receive loans from the financial insti-tutions operating within the country and also from the public. Modem government also taken loans from inter-national financial institutions.
d) Grants-in-aid:
Grants are amount received without any condition of repayment. They are not repaid.
These are two types.
1. General grant,
2. Specific grant.
Question 15.
State the objectives of Central Bank/Reserve bank.
Answer:
Central bank is the apex bank of the banking system in a country. It controls, regulates and supervises the activities of the banks in the banking system of a country. The following are the objectives of the central bank.
- Maintaining the internal value of currency.
- Preserve the external value of currency.
- Ensure price stability.
- Promote economic development.
- Develop financial institutions.
Question 16.
Enumerate the measures for control of Inflation.
Answer:
It refers to a persistent upward movement in the general price level rather than once for all rise in it. If results in a decline of the purchasing power. There is no generally accepted definition to inflation. According to “Hawtrey” is “issue of too much currency”. According to “Dalton” as “too much money chasing too few goods”.
To control the inflation the government has taken various steps. They are :
- Increase the production in the long run.
- Implementing proper monetary and fiscal policies to reduce the supply of money and credit.
- Controlling prices and eliminating black markets.
- Importing the goods which are scares in supply from outside countries.
- Introducing rationing and quota system in case of man consumption of goods.
- Distribution of goods to all the needy sections of the people.
Question 17.
Write the relationship between Economics and Statistics?
Answer:
There is close relationship between statistics and economics. In the words of Tugwell “The science of economics is becoming statistical in its method”. All the economic laws are pronounced on the basis of statistical facts, and figures. The theory of population of Malthus, law of family expenditure of Engels etc., were propounded after statistical tests. Statistics helps the economics to become an exact science.
In the study of theoretical economics, the application and use of statistical methods are of great importance. Most of the doctrines of economics are based on the study of a large number of units and their analysis. This is done through statistical methods. Law of demand was formulated because of statistical methods.
The importance statistics is felt in all branches of knowledge in accountancy and auditing in banking, in insurance, in research and many fields. Without statistics no branch of knowledge is complete.
Section – C
Note : Answer ANY EIGHT out of the following twelve question (15 × 2 = 30)
Question 18.
Wealth.
Answer:
Wealth means stock of assets held by an individual or insti-tution that yields has the potential for yielding income in some form. Wealth includes money, shares of companies, land etc. Wealth has three properties. 1. Utility 2. Scarcity 3. Transferability.
Question 19.
Price.
Answer:
The price of anything is its value measured in terms of money i.e. the value of a commodity expressed in terms of money. For Ex : a commodity is exchanged for 50 rupees then the price of commodity is 50 rupees.
Question 20.
Price line/Budget line.
Answer:
The budget line or price line shows all possible combina¬tions of two goods that a consumer can buy with the given income of the consumers and prices of the two goods.
Question 21.
Giffen’s Paradox/Giffen Goods.
Answer:
It means necessary goods. Sir Robert Giffen in mid 19fh cen-tury observed that the low paid workers in England purchased more bread when its price increase by decrease in the purchase of meat. The increase in demand for bread when price increased is an ex-ception to the law of demand, it is known as Giffen’s paradox.
Question 22.
Cross Demand.
Answer:
Cross demand refers to the relationship between any two goods which are either complementary to each other or substitute of each other at different prices. ,Dx = f(Py).
Question 23.
Production function.
Answer:
The production function is the none for the relation between the physical input and physical output of a firm production of a firm. Production function explains the functional relationship between inputs and outputs this can be follows as Gx = f (L, K, R, N, T)
Question 24.
Price discrimination.
Answer:
Monopolist will charge different prices for the same com-modity or service in the market. This is known as discriminating monopoly or price discrimination.
Question 25.
Selling Costs.
Answer:
An important feature of monopolistic market is every firm makes expenditure to sell more output. Advertisements through newspapers, journals, electronic media etc., these methods are used to attract more consumers by each firm. This type of expenditure is called selling cost.
Question 26.
Transfer earnings.
Answer:
Transfer earnings was introduced by Mrs. John Robinson. It is also called as the ‘opportunity cost’ in explaining rent. Transfer earnings means what a factor production may be earning in its present employment over what it could earn in its next best employ¬ment or what a factor can earn in its next best alternative use.
Question 27.
Net interest.
Answer:
Net interest is the reward for the service of the capital loan. Ex: Net interest paid on government bonds and government loans.
Question 28.
Per capita income.
Answer:
It is average income received by a citizen of a country in a year. We arrive at percapita income by dividing the national income with the population of a country.
Percapita income = \(\frac{National income }{\sqrt{Population}}\)
Question 29.
Budget
Answer:
The statement total expenditure and total Revenue receipts are called Budget. There are three types of Budget.
- Surplus Budget
- Deficit Budget
- Balanced Budget.
Question 30.
Fiscal deficit
Answer:
Fiscal deficit is the difference between the total revenue and total expenditure minus the market borrowings.
Fiscal deficit = (Total revenue – Total expenditure) + Other borrowings and other liabilities
Question 31.
Liquidity.
Answer:
Liquidity means the ease with which one can convert a financial asset into a medium of exchange. Liquidity is greatest for money as an asset into a medium of exchange. It is greatest for money as an asset because money itself is a medium of exchange. Infact money is the only asset which possess perfect liquidity.
Question 32.
Currency.
Answer:
Currency consists of paper notes and coins paper notes are issued by the government or the central bank of a country. In India the reserve bank which is the central bank of India issue currency notes at all denominations except one rupee notes. The government of India issue them coins are metallic tokens and are produced in the minis of government.
Question 33.
Overdraft.
Answer:
Overdraft is permissable on current account only. The cur¬rent account holders are given the facility overdrafts by which they are allowed to draw an amount above their balances. However they can overdraw the amount upto a certain limit fixed by the bank.
Question 34.
Creation of credit.
Answer:
It means the process of creating credit from the depositor received by the bank from the customer to those who is in need of many in the form of loans and advances..
Question 35.
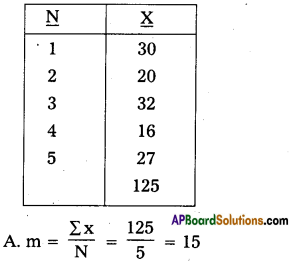
Find out A.m of the data 30, 20, 32, 16, 27
Answer:
Question 36.
Find the mode for the data 12, 11, 15, 11, 12, 12, 15, 12, 9, 12
Answer:
From the above data the number how many times repeated is known as Mode. Hence the value of mode is equal to 12.
Question 37.
What is pie diagram?
Answer:
It is also called pie chart. The circle is divided into many parts as there are components by drawing straight lines from the centre to the circumference.