The strategic use of AP Inter 1st Year Economics Model Papers and AP Inter 1st Year Economics Question Paper March 2015 allows students to focus on weaker areas for improvement.
AP Inter 1st Year Economics Question Paper March 2015
Note : Read the following instructions carefully :
- Answer ALL the questions as per the choice specified. Draw suitable diagrams wherever necessary.
- Questions from Serial Nos. 1 to 5 in Section ‘A’ are of Long Answer Type. Each question carries TEN marks. ANY THREE questions j may be answered out of five given questions. Every answer may he limited to 40 lines.
- Questions from Serial Nos. 6 to 17 in Section ‘B’ are of Short Answer Type. Each question carries FIVE marks. ANY EIGHT questions may be answered out of twelve given questions. Every answer may be limited to 20 fines.
- Questions from Serial Nos. 18 to 37 in Section ‘C’ are of Very Short Answer Type. Each question carries TWO marks. ANY FIFTEEN questions may be answered out of twenty given questions. Every answer may be limited to 5 fines.
Section – A
Note : Answer ANY THREE out of the following five questions. (3 × 10 = 30)
Question 1.
Explain the law of diminishing marginal utility and its limitations.
Answer:
H.H. Gossen was the first economist to explain the law of diminishing marginal utility in 1854. This is also known as “Gossen’s first law”. In 1890 Marshall in his “Principles of economics” developed and popularised this analysis. This law is based on the common experience of every consumer.
This law explains the functional relationship between the stock of a commodity and the marginal utility of that commodity. If a consumer goes on increasing his stock of a thing, additional utility derived from an additional unit declines. Alfred Marshall’ defines the “Law of diminishing marginal utility” as “The additional benefit which a person derives from a given increase of his stock of a thing diminishes with every increase in the stock that he already has”.
Total Marginal Utility:
The want satisfying capacity of a thing is called utility. It can be explained as total utility and marginal utility. Total utility is the sum of the marginal utilities. Total utility tends to be more with larger stock and less with smaller stock. TUn = f(Qn)
Marginal utility is the additional utility obtained from an additional unit of any commodity consumed.
MUn =TUn – TUn-1
Explanation of the law:
The law of diminishing marginal utility explains the relation between the quantity of good and its marginal utiltiy. If a person goes on increasing his stock of a thing the marginal utility derived from an additional unit declines. The law is clear from the following table.
Total Utility and Marginal Utility Schedule:
| No. of Apples | Total Utility (Utils) | Maarginal Utility (Utils) |
| 1 | 20 | 20 |
| 2 | 35 | 15 |
| 3 | 45 | 10 |
| 4 | 50 | 5 |
| 5 | 50 | 0 |
| 6 | 45 | -5 |
| 7 | 35 | -10 |
In the above table total utility increasing at a diminishing rate till 5th apple and becomes maximum. Marginal utility declining positively till 4th apple and become zero at the 5th apple. From the 6th and 7th apples total utility declines positively and marginal utility becomes negative. Zero marginal utility implies the point of satiety, which indicates the complete satisfaction of a given want.
Relation between total utility and marginal utility:
- When total utility increases at a diminishing rate, marginal utility diminishes.
- When total utility is maximum, marginal utility becomes zero.
- When total utility decreases positively, marginal utility becomes negative.
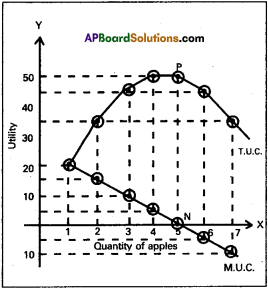
The law of diminishing marginal utility can also be represented diagramatically with the help of the marginal and total utility curves.
In the diagram the horizontal axis shows the units of the commodity and vertical axis measures the utility obtained from the units. The T.U.C. represents total utility and M.U.C. represents marginal utility curves.
The T.U.C. curve slopes up-wards from left to right upto point ‘P’ and then slopes downward from left to right. The M.U.C. slopes downwards from left to right. It cuts the X – axis at point ‘N’ when total utility at its maximum. It means the marginal utility is equal to zero, when total utility is at its maximum. If the consumer consumes apples further, the total utility curveT.U.C. falls from point ‘P’ and slopes downwards from left to right. Therefore M.U.C. is below X- axis after ‘N’ point. It means the marginal utility is negative.
Limitations of the law: There are certain limitations to the law.
- One of the important assumptions of the law is that consumer’s tastes and preferences remains constant. If there is any change in consumer’s habits and preferences this law does not hold good.
- This law is not applicable for durable goods, as we can use these commodities for a longer time and measurement of utility is not possible.
- In case of complementary goods where we need two or more goods to satisfy a single want this law does not apply.
- If it is not possible to divide fhe commodity into small units, we can not measure the utility of successive units. So this law is not applicable for indivisible goods.
- Hobbies like stamps and coin collection are an exception to the law of diminishing marginal utility, as the additional units give more satisfaction to the consumer.
![]() .
.
Question 2.
Explain the law of variable proportions.
Answer:
The law of variable proportions is also known as the Law of diminishing marginal returns. Economists like Ricardo, Malthus, Marshall gave more importance to this law and propounded their theories by keeping this law as basis. The law of variable propor-tions refers to the short-run. According to the classicals and Marshall, this law is applicable to the agricultural sector only. But the modern economists hold that the law is applicable to all the sectors.
The law of variable proportions explains the changes in output when a factor of production is varied while keeping other factors constant in the short period. The law states that if more and more units of variable input is applied to a given quantity of fixed inputs, the total output may initially increases at an increasing rate but beyond a certain level, the rate of increase in the total output diminishes.
According to ‘Marshall’:
“An increase in the amount of labour and capital applied in the cultivation of land causes in general, a less than proportionate increase in the amount of output raised unless it happens to coincide with an improvement in the arts of agriculture”.
According to ‘Benham’:
“As the proportion of one factor in a combination of factors is increased, after a certain point. First the marginal and then the average product of that factor will diminish”.
Assumptions of the law:
- The state of technology remains unchanged.
- Input prices remain unchanged.
- It is possible to vary the proportions in which the various inputs are combined.
- All units of the variable factors are homogeneous.
- It is assumed that the entire operations belongs to short period.
- The product should be measured in physical units.
Explanation of the law:
Let us illustrate the law with the help of table where on the fixed units of land of two acres, units of variable factor are employed keeping other factors constant. The changes in total product, average product and marginal product can be observed in the following schedule.
| Variable factor (labour) | Total product (quintals) | Average product (quintals) | Marginal product (quintals) | Stages |
| 1 | 3 | 3 | 3 | I
Increasing returns to stage |
| 2 | 7 | 3.5 | 4 | |
| 3 | 12 | 4 | 5 | |
| 4 | 16 | 4 | 4 | |
| 5 | 19 | 3.8 | 3 | II
Diminishing returns stage |
| 6 | 21 | 3.5 | 2 | |
| 7 | 22 | 3.1 | 1 | |
| 8 | 22 | 2.8 | 0 | III
Negative returns stage |
| 9 | 21 | 2.3 | -1 | |
| 10 | 19 | 1.9 | -2 |
Total production:
Sum of the marginal productions is called total production. Total product refers to the total output produced per unit of time by all the labours employed.
Average production:
It refers to the product per unit of labour. If total’ product is divided by the number of labourers employed we get average product.
Marginal product: It is the additional product obtained by employing an additional labour.
Marginal product = \(\frac{\Delta \mathrm{TP}}{\Delta \mathrm{L}}\)i.e
\(\frac{Change in total output}{Change in labour}\)
Increasing returns:
In the above table total production increasing at increasing rate upto the 4th labourer then the average and marginal production also increasing. At the 4th labourer the average product (4 units) is equal to the marginal product (4 units). This is the ‘First stage’ which is known as the stage of ‘Increasing returns’.
Diminishing returns:
In this stage total production increasing at diminishing rate and becomes to maximum then the average production and marginal productions are diminishing. In the above table at the 8th labourer total production reaches to maximum (22 units) and marginal production becomes to zero. This is the ‘second stage’ which is known as the stage of diminishing returns.
Negative returns:
In this stage total production diminishing positively, average production also but marginal production becomes negative. This is the third stage which is known as the ‘Stage of Negative Returns’. Let us illustrate the law with the help of a diagram.
In the diagram TP, MP and AP curves inverse, at first reach their maximum and then start declining. The first stage relates to increasing return stage. When more units of labour are applied to a fixed factor, the fixed factor is used more intensively and productivity increases rapidly. This stage is shown in the diagram
from O to C. TP, AP and MP are increasing is noted in this stage. A rational producer will not stop his production in this stage. In the third stage marginal product becomes zero and negative. A rational producer will not undertake production in this stage. This stage starts from point ‘N’. These two stages will not feasable and profitable. Therefore, production will always take place in the second stage but not at the end of the IInd stage because, the MP is equal to zero.
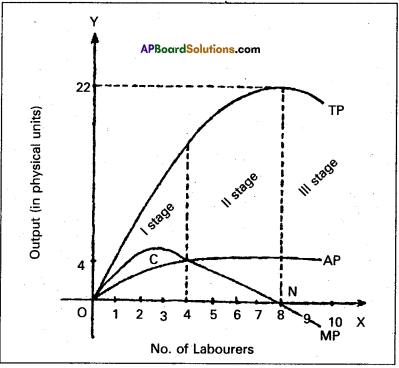
In the I stage MP curve first rises and start falling after reaching maximum. In the II stage AP starts falling. MP and AP are falling but TP is still rising. In the III stage TP, AP and MP are all falling but MP becomes negative.
Importance of the law: This law has several theoretical and practical usages.
- This law is the basis for Malthus population theory of population.
- It is the basis of Ricardian theory of rent.
- It helps to agricultural sector.
- It helps to industrial sector for taking decisions.
![]()
Question 3.
Explain the classification of markets.
Answer:
Market is commonly thought of as a place where commodi¬ties are bought and sold and where buyers and sellers meet. But in economics, the word market does not refer to any particular place. It refers to a region. “Market implies the whole area over which buyers and sellers are in such touch with each other, direction or through middlemen, that the price of the commodity in one part influences it in other parts of it”.
Classification of markets:
Markets can be classified on the basis of
- area covered,
- time and
- degree of competition.
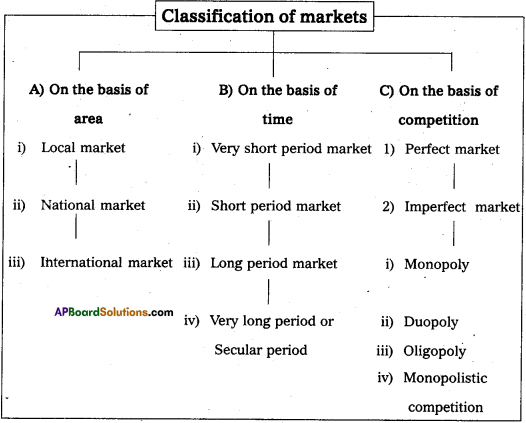
A) On the basis of area: On the basis of area the markets are classified into three.
- Local market:
A product is said to have local market, when buyers and sellers of the product carry on the business in a particular locality, These goods are highly perishable cannot to take to distant places. They cannot even stored for a longer time. Ex : Vegetables, milk, fruits etc. - National market:
A national market is said to exist when a commodity is demanded and supplied all over our country. Generally the market of durable and industrial goods cover the entire nation. Ex : Wheat, sugar, cotton etc. - International market:
International market or world market exists when the buyers and sellers are spread all the world for a commodity. Ex : Gold, silver, diamonds etc.
B) On the basis of time : Marshall classified these markets into four categories.
- Very short period market:
The supply is fixed in this market. It may be one day or two days. Perishable goods like fish, vegetables, flowers etc., do have only very short period market. There is no difference between supply and stock of the commodity. - Short period market:
This period is long enough only to change variable factors of production in changing the output. During this period supply can be changed only to some extent, but not totally for a given change in the demand. - Long period market:
The long period market is one which is long enough to change the supply totally for a given change in the demand. This period permits to change all the factors of production in changing output. Therefore all factors of production are variable. - Very long period or secular period:
This is the period in which the size of population, supplies of rawmaterials, lachs of people etc., would have enough time to change. There is enough time to introduce innovations. In this period changes take place even in th& factors of production.
c) On the basis of nature of competition : On the basis of nature of competition, markets are classified into two :
1) Perfect market:
A market is said to be perfect when the competition exists when buyers and sellers are having perfect knowledge about the market conditions. They are large in number. There will only one price for a commodity through out the market etc.
2) Imperfect market:
A market is said to be imperfect when some buyers and sellers both are not aware of the offers being made by others. Buyers and sellers do not have perfect knowledge about the price in different places. Thus price is not uniform throughout the market. It differs from place to place and from seller to seller. Imperfect market can take several forms. They are :
a) Monopoly,
b) Duopoly,
c) Oligopoly and
d) Monopolistic competitions.
a) Monopoly:
Monopoly means a single producer,. Where one producer supplies the commodity to the market. The product supplied by a monopolist will not have close substitutes in the market.
b) Duopoly:
Duopoly is one type of oligopoly market. There are only two producers in the market. They make decisions either independently or together.
c) Oligopoly:
Oligopoly is a market with a few producers. Each firm produces a considerable part of the output. Decisions of one firm affect the other firms.
d) Monopolistic competition:
It is a market where several firms produce a commodity with small differences. Firms advertise their goods to prottiote sales.
Question 4.
Explain the various methods of calculating National Income.
Answer:
The concept of National Income did not receive much atten-tion from the economists until the great economic depression of thirties. National Income is determined by the volume of employment. J.M. Keynes brought out the importance of National Income and employment in economic theory to achieve rapid economic development. The study of National Income is important.
“National Income or National dividend is the flow of goods and services produced and made available to the people in a country in a year”. National Income may be interpreted in three ways:
- The total value of output in a country in a year,
- The total value of all incomes received by the owners of factors of production in a year,
- The total expenditure incurred on all goods and services in a year.
According to ‘Marshall’:
“The labour and capital of a country, acting upon its natural resources produce annually a certain net aggregate of commodities, material and immaterial including services of all kinds.
According to ‘Pigou’:
“The national dividend is that part of the objective income of the community including of course, income derived from abroad which can be measured in money”.
According to ‘Irving Fisher1:
‘The National dividend or income consists solely of services as received by ultimate consumers : whether from their material or from their human environments”.
Methods of measuring National Income: There are three methods of measuring National Income. They are
- Net output method or Value added method,
- Income method and
- Expenditure method.
1. Product Method or Output Method:
GNP is total value of final goods and services produced in a year. The final goods are valued at market prices, whether sold or added on inventories. Gross National Product (GNP) is always stated in money term. No item should be counted twice. To avoid double counting we exclude raw materials and intermediate goods. Ex : We include the value of bread only but not include the value of flour which used to make •bread.
2. Income Received or Income Method:
We added the income received by individuals and other for the services rendered by them in production. The total incomes of the factors of production put together is the National Income. The following precautions are to be taken, in estimating National Income.
- Exclude all transfer payments like old age pensions, interests etc.
- Exclude all illegal incomes and wind fall gains.
- Value of production for self-consumption and imputed rent of owner occupied houses.
- Incomes divided from the sale of second hand goods shall not be included.
- We should not count any income twice. Ex : The profits distributed by companies will be included in incomes of the shareholders. So it shall not be included in the incomes of companies.
3. Expenditure Method: This process of adding up expenditure on all final goods is called the expenditure approach. The Gross National Product is divided into four component parts according to who buys the goods and services,
- Goods and services bought by consumers;
- Investmtent goods purchased by business houses;
- A combination of consumer and investment goods purchased by government and
- Net exports (Value of exports minus value of imports) to foreign countries. It is the aggregate value of current production of goods and services flowing to the consumer business houses, government and foreign countries.
![]()
Question 5.
Explain the Keynesian theory of Employment.
Answer:
Keynesian theory of employment is the principle of effective demand. He called his theory, general theory because it deals with all levels of employment. Keynes explains that lack of aggregate demand is the cause of unemployment. He used the terms aggregate demand, aggregate supply.
It means total. The term effective demand is used to denote that level of aggregate demand which is equal to aggrerate supply According to Keynes where aggregate demand and aggregate supply are intersected at that point effective demand is determined. This effective demand will determine the level of employment.
Aggregate supply schedule:
The aggregate supply schedule shows the various amounts of the commodity that will be offered for sale at a series of price. As the level of output increases with the level of employment. The aggregate supply price also increases with every increase in the level of employment. The aggregate supply curve slopes upwards from left to right. But when the economy reaches the level of the full employment, the aggregate supply curve becomes vertical.
Aggregate demand schedule:
The various aggregate demand prices at different level of employment is called aggregate demand price schedule. As the level of employment rises, the total income of the community also rises and therefore the aggregate demand price also increases. The aggregate demand curve slopes upward from left to right.
Equilibrium level of income:
The two determinants of effective demand aggregate supply and aggregate demand prices combined schedule is shown in the following table
| Level of employment (in lakhs of workers) | Aggregate supply price (in crores of ₹) | Aggregate demand price (in crores of ₹) |
| 20 | 200 | 175 |
| 30 | 250 | 225 |
| 40 | 300 | 300 AD = AS |
| 50 | 350 | 325 |
| 60 | 400 | 425 |
The table shows that so long as the demand price is higher than the aggregate supply price. The level of employment 40 lakh workers aggregate demand price is equal to aggregate supply price i.e., 300 crores. So effective demand in the above table is ₹ 300 crores. This can be shown in the following diagrams.
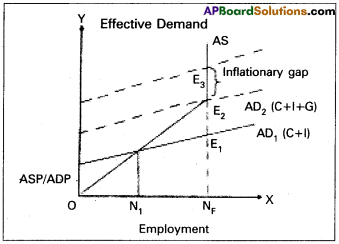
In the diagram ‘X’ axis represents the employment and T axis represents price. AS is aggregate supply curve AD is aggregate demand curve. The point of intersection between the two ‘Ej’ and ‘E2’. points. This is effective demand where all workers are employed at this point the entrepreneurs expectation of profits are maximised. At any other points the entrepreneurs will either incur losses or earn sub-normal profits.
Section – B
Note : Answer ANY THREE out of the following five twelve question (8 × 5 = 40)
Question 6.
Explain the characteristics of wants.
Answer:
Wants are the starting point of all economic activities. As social conditions improve, people prefer not only to satisfy their basic needs but also to have comforts and luxuries. So if one want is satisfied, the other crops up. If there are no wants, there is no consumption, no production, no exchange, no distribution etc.
Characteristic features of human wants : Human wants are not uniform or similar. They differ from person to person, time to time and place to place. Wants are having the following characteristic features.
1) Wants are unlimited:
Human Wants are unlimited. There is no end to human wants. When want is satisfied another want takes its place. A person who has no cycle would like to have it in the first instance, latter scooter, car etc.
2) A particular want is satiable:
Although a man cannot satisfy all his wants, a particular want cam be satisfied completely in a period of time. It is possible because the intensity of wants is limited. Ex : Want for T.V can be satisfied by purchasing a T.V An important law in economics known as the law of Diminishing Marginal Utility is based on this characteristic.
3) Wants are competitive:
Human wants are unlimited. But the means to satisfy them are limited of scarce. Hence it is possible for us to satisfy some wants only and leave the rest. So, every want completes with other to get satisfied.
4) Wants are complementary:
To satisfy a particular want we need a group of commodities at the same time. In other words, satisfaction of a single want requires the simultaneous consumption of a number of commodities. Ex : To satisfy the want for coffee we need milk, sugar, decoction etc.
5) Wants are alternative:
Most of our wants can be satisfied by different ways. For example : we can satisfy our hunger either by taking meal or bread or fruits or milk etc. Thus particular want can be satisfied by several alternatives.
6) Wants are recur:
Many of the human wants are recur. They appear again and again although they satisfied completely in a particular time period. Ex: If we feel hungry, we take some food and satisfy this want. But after some time we shall again feel hungry.
7) Wants differ in urgency:
All our wants are not equally important or urgent. They differ greatly in intensity. Some wants are more urgent and other are less urgent.
Question 7.
What are various types of utility?
Answer:
The wrant satisfying capacity of a commodify at a point of time is known as utility. Types of utility:
- Form utility:
Form utilities are created by changing the shape, size and colour etc., of a commodity so as to increase its want satisfying power. Ex: Conversion of a wooden log into a chair. - Place utility:
By changing the place some goods acquire utility. Ex: Sand on the sea shore has no utility. If it is brought out and transported to market, it gains utility. This is place utility. - Time utility:
Time utilities are created by storage facility. Ex: Business men store food grains in the stock points in the off season and releases them to markets to meet high demand and obtained super normal profits. - Service utility:
Services also have the capacity to satisfy human wants. Ex: Services of Lawyer, Teacher, Doctor etc. These services directly satisfy human wants. Hence they are called as service utilities.
![]()
Question 8.
Explain the properties of tKe indifference curves.
Answer:
Indifference curve shows the various combinations of two commodities which yield equal utility or satisfaction to the con-sumer.
Indifference schedule:
According to A.L. Meyers “An indifference schedule may be defined as schedule of various combinations of goods that will be equally satisfactory to the individual concerned”. This can be explained with the help of a table and diagram.
| Combinations | Number of x | Number of y |
| A | 1 | 20 |
| B | 2 | 15 |
| C | 3 | 11 |
| D | 4 | 8 |
| E | 5 | 6 |
| F | 6 | 5 |
In the above schedule the consumer gets as much total satisfaction from combination A and as well as from other combinations B, C, D, E and F, the total satisfaction is seeme in all these combinations. Since consumer get same satisfaction he is indifferent to select any one of the combinations. Therefore this may be called “weak ordering”.
Indifference curve:
With the help of the above table we can draw an indifferent curve to study its properties. In the side diagram ‘X’ good are shown on ‘OX’ axis ; and ‘Y’ good shown on ‘OY’ axis.
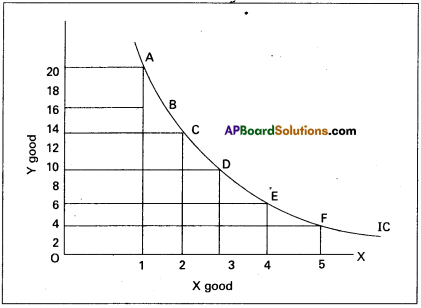
IC is the indifferent curve. A, B, C, D, E, and, F are the various combinations of X and Y. The points on indifference curves give the consumer the equal level of satisfaction of various points is the same that isA = B = C = D = E = E
Properties of indifference curves: The important properties of Indifference curve are
- Indifference curves slopes downwards from left to right there exists negative slope.
- Higher indifference curve represent higher levels of satisfaction. Indifference curve to the right represents high satisfaction.
- The indifference curves can never meet or intersect each other.
- The indifference curves are convex to the origin.
- Indifference curves need not be parallel to each other.
Question 9.
Explain the exceptions to the law of Demand.
Answer:
In Economics demand means a desire which is backed up by ability to buy and willingness to pay the price. Thus demand will be always at a price and time. According to Marshall “The amount demanded increases with a fall in price and disminishes with rise in price when other things remain the same”.
Exceptions:
In certain situations, more will be demanded at higher price and less will be demanded at a lower price. In such cases the demand curve slopes upward from left to right which is called an exceptional demand curve. This can be shown in the fol-lowing diagram.
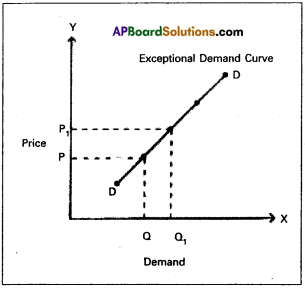
In the diagram when price increases from OP to OP1, de-mand also increases from OQ to OQ1 This is opposite to law of demand.
1) Giffen’s Paradox:
This was stated by Sir Robert Giffen. He observed that poor people will demand more of inferior goods, if their prices raise. Inferior goods are known as Giffen goods. Ex: Ragee, Jowar etc. He pointed out that in case of the English workers, the law of demand does not apply to bread. Giffen noticed that workers spend a major portion of their income on bread and only small portion on meat.
2) Veblen Effect (Prestigious goods):
This exception was stated by Veblen. Costly goods like diamonds and precious stones are called prestige goods or veblen goods. Generally rich people purchase those goods for the sake of prestige. Hence rich people may buy more such goods when their prices rise.
3) Speculation:
When the price of a commodity rises the group of speculators expect that it will rise still further. Therefore, they buy more of that commodity. If they expect that there is a fall in price, the demand may not expand. Ex: Shares in the stock market.
4) Illusion:
Some times, consumer develop to false idea that a high priced good will have a better quality instead of low priced good. If the price of such good falls, demand decreases, which is contrary to the law of demand.
Question 10.
Define price elasticity of Demand. Explain briefly various types of price elasticity of Demand.
Answer:
A percentage change in price leads to a percentage change in quantity demanded. The relation between these two concepts are known as price elasticity of demand. Here we assume income of the consumer prices of related goods are remaining the same this canbe expressed as follows
Price elasticity of demand
= \(\frac{Proportionate change in quantity deman}{Proportionate change in price}\)
or Price elasticity of demand
= \(\frac{Proportionate change in quantity deman}{Proportionate change in price}\)
Tripes of price elasticity of demand:
- Perfectly elastic demand (Ed = ∞)
- Perfectly inelastic demand (Ed = 0)
- Unitary elastic demand (Ed = 1)
- Relatively elastic demand (Ed > 1)
- Relatively inelastic demand (Ed < 1)
1) Perfectly elastic demand:
It is also known as “infinite elastic demand”. A small change in price leads to an infinite change in demand is called perfectly elastic demand. It is horizontal straight line to ‘X’ axis. The numerical value of perfectly elastic demand is infinite (Ed = ∞). It can be shown in the diagram.
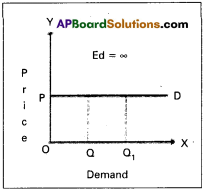
In the diagram, Ed = \(\frac{\mathrm{OQQ}_1}{\mathrm{OQ}} \div \frac{\mathrm{O}}{\mathrm{OP}}=\frac{\mathrm{QQ}_1}{\mathrm{OQ}} \times \frac{\mathrm{OP}}{\mathrm{O}}\) = ∞
2) Perfectly inelastic demand : It is also known as “zero elastic demand”. In this case even a great rise or fall in price does not lead to any change in quantity demanded is known as per¬fectly inelastic demand. The demand curve will be vertical to the V axis. The numerical value is ‘O’. This can be shown in the following diagram.
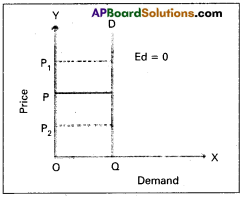
In the diagram, [/latex]\frac{\text { Zero }}{\mathrm{OQ}} \div \frac{\mathrm{PP}_1}{\mathrm{OP}}[/latex] = 0
∴ Ed = 0
3) Unitary elastic demand:
The percentage change in price leads to same percentage change in demand is called unitary elastic
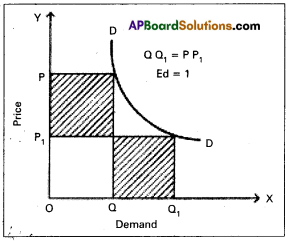
demand. In this case the elasticity’of demand is equal to one. The shape of demand curve is “Rectangular Hyperbola”. This can be shown in the following.
In the diagram, Ed = OP1Q1 = OPQ
(or) OQ1 = PP1
∴ Ed = 1
4) Relatively elastic demand:
When a percentage change in price leads to more than percentage change in quantity demand is called relatively elastic demand. In this case the numerical value of Ed is greater than one (Ed > 1)
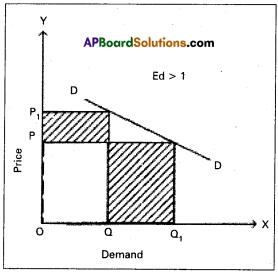
In the diagram, Ed = OQ1 > PP1
∴ Ed > 1
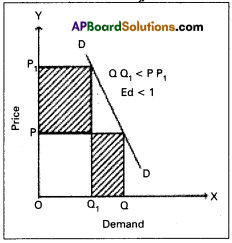
5) Relatively inelastic demand:
When the percentage change in price leads to a less than percentage change in quantity demand is called relatively inelastic demand. Here the numerical value is less than one (Ed < 1). This can be shown to following diagram.
Question 11.
What is meant by Real Wages ? What are the factors that determine Real Wages?
Answer:
The amount of goods and services that can be purchased with the money wages at any particular time is called real wage. Thus real wage is the amount of purchasing power received by worker through his money wage.
Factors determining the real wages :
- Methods of form of payment:
Besides money wages, normally the labourers get same additional facilities provided by their management. Ex : Free housing, free medical facilities etc. As a result this real wage of the worker will be high. - Purchasing power of money:
An important factor which determines the real wage is the purchasing power of money which depends upon the general price level. A rise in general price level will mean a full in the purchasing power of money, causes decline in real wages. - Nature of work:
The working conditions also determine the real wages of labourer. Less duration of work, ventilation, fresh air etc., result in high real wages, lack of then facilities real wages are low even though money wages are high. - Future prospects:
Real wage is said to be higher in those jobs where there is possibility of promotions hike in wages and vice-versa. - Nature of work:
Real wages are also determined by the risk and danger involved in the work. If work is risky wages of labourer will be low though money wages are high. Ex : Captain in a submarine. - Timely payment:
If a labourer receives payment regularly and timely the real wages of the labourer is high although his money wage is pretty less and vice-versa. - Social prestige:
Real wage depends on social prestige. The money wages of Bank officer and judge are equal, but the real wage of a judge is higher than bank officer. - Period and expenses of education:
Period and expenses of training also affect real wages.
![]()
Question 12.
What are the factors that determine the National Income?
Answer:
National Income is the total market value of all goods and services produced in a country during a given period of time. There are many factors that influence and determine the size of national income country.
a) Natural resources:
The availability of natural resources in a country, its climatic conditions, geographical features, fertility of soil, mines and fuel resources etc., influence the size of National Income.
b) Quality and Quantity of factors of production:
The national income of a country is largely influenced by the quality and quantity of a country’s stock of factors of production.
c) State of technology:
Output and national income are in-fluenced by the level of technical progress achieved by the country. Advanced techniques of production help in optimum utiliza¬tion of a country’s national resources.
d) Political will and stability:
Political will and stability in a country helps in planned economic development and for a faster growth of National Income.
Question 13.
“Supply creates its own demand.” Comment on the statement.
Answer:
Classical theoiy of employment or the theory of output and employment developed by economists such as Adam Smith, David Ricardo, Robert Malthus etc., it is based on the J.B Say’s law of market’. According to this law “supply creates its own demand”. The classical theory of employment assumes that there is always full employment of labour and other resources.
According to this law the supply always equals to demand it can be expressed as S = D. Whenever additional output is produced in the economy. The factors of production which participate in the process of production. Earn income in the form of rent, wages, interest and profits.
The total income so generated is equivalent to the total value of the additional output produced. Such income creates addition demand necessary for the sale of the additional output. Therefore the question of addition output not being sold does not arise.
Question 14.
What are the sources of public revenue?
Answer:
Revenue received by the government from different sources is called public revenue. Public revenue is classified into two kinds.
1) Tax revenue
2) Non-tax revenue.
1) Tax Revenue:
Revenue received through collection of taxes from the public is called tax revenue. Both the state and central government collect taxes as per their allocation in the constitution.
Taxes are two types.
a) Direct taxes:
i) Taxes on income and expenditure.
Ex: Income tax, Corporate tax etc.
ii) Taxes on property and capital assets.
Ex: Wealth tax, Gift tax etc.
b) Indirect taxes: Taxes levied on goods and services.
Ex: Excise duty, Service tax.
2) Non – tax revenue:
Government receives revenue from sources other than taxes and such revenue is called non-tax rev-enue. They are
a) Administrative revenue:
Government receives money for certain administrative services. Ex : License fee, Tution fee etc.
b) Commercial revenue:
Modem governments establish public sector units to manufacture certain goods and offer certain services. The goods and services are exchanged for the price. So such units earn revenue by way of selling their products. Ex : Indian Oil Corporation, Bharath Sanchar Nigam Ltd, Bharath Heavy Electricals Ltd.Indian Railways, State Road Transport Corporations, Indian Air lines etc.,
c) Loans and advances:
When the revenue received by the government from taxes and from the above non-tax sources is not sufficient to meet the needs of government expenditure, it may receive loans from the financial insti-tutions operating within the country and also from the public. Modem government also taken loans from inter-national financial institutions.
d) Grants-in-aid:
Grants are amount received without any condition of repayment. They are not repaid. These are two types.
1. General grant
2. Specific grant.
![]()
Question 15.
State the objectives of a Central Bank.
Answer:
Central bank is the apex bank of the banking system in a country. It controls, regulates and supervises the activities of the banks in the banking system of a country. The following are the objectives of the central bank.
- Maintaining the internal value of currency.
- Preserve the external value of currency.
- Ensure price stability.
- Promote economic development.
- Develop financial institutions.
Question 16.
State the types of inflation.
Answer:
It refers to a persistent upward movement in the general price level rather than once for all rise in it. If results in a decline of the purchasing power. There is no generally accepted definition to inflation. According to “Hawtrey” is “issue of too much currency”. According to “Dalton” as “too much money chasing too few goods”, A Inflation means a general rise in prices. Based on the rate of inflation, it may be divided into four types.
- Creeping inflation: When rise in the prices is very slow and small, it is called creeping inflation.
- Walking inflation: This is the second stage of inflation. The inflation rate will be between 2% and 4%.
- Running inflation: When the rate of inflation is in the range of 4 -10% per annum, it is called running inflation.
- Galloping inflation or hyper inflation: If the inflation rate exceeds 10%, galloping inflation occurs. It may also called hyper inflation.
Question 17.
What is the relationship between Economics and Statistics?
Answer:
There is close relationship between statistics and economics. In the words of Tugwell ‘The science of economics is becoming statistical in its method”. All the economic laws are pronounced on the basis of statistical facts and figures. The theory of population of Malthus, law of family expenditure of Engels etc., were propounded after statistical tests. Statistics helps the economics to become an exact science.
In the study of theoretical economics, the application and use of statistical methods are of great importance. Most of the doctrines of economics are based on the study of a large number of units and their analysis. This is done through statistical methods. Law of demand was formulated because of statistical methods.
The importance statistics is felt in all branches of knowledge in accountancy and auditing in banking, in insurance, in research and many fields. Without statistics no branch of knowledge is complete
Section – C
Note : Answer ANY EIGHT out of the following twelve question (15 × 2 = 30)
Question 18.
Economic goods
Answer:
Economic goods are man made. They have cost of production and price. They are limited in supply. They have both value in use and value in exchange. Ex : Pen, Book etc. Economic goods are also called scarce goods.
Question 19.
Price
Answer:
The value of a commodity expressed in terms of money is known as price. The price of anything is its value measured in terms of a standard money value. Ex : A pen is exchanged for 10 rupees than the price of that pen is 10 rupees.
Question 20.
Cardinal utility
Answer:
Alfred Marshall developed cardinal utility analysis. Accord¬ing to this analysis the utilities derived from consumption of dif¬ferent commodities can be measured in terms of arbitary units called utils. 1, 2, 3, 4 are called cardinal numbers.
Question 21.
Cross Demand
Answer:
Cross demand refers to the relationship between any two goods which are either complementary to each other or substitute of each other at different prices. Dx = f(Py).
Question 22.
Demand function
Answer:
It shows functional relationship between quantity demanded at various factors that determine the demand for a commodity.
It can be expressed as follows.
Dx = f(PxP1……Pn Y,T)
Where
Dx = Demand for good x
Px = Price of x
P1 …. Pn = Prices of substitutes and complementary
Y = Income of consumer
T = Tastes
f = Functional relationship
![]()
Question 23.
Law of Supply
Answer:
The quantity of a commodity that a seller is prepared to sell at a particular price and at a particular time is known as supply. If other things are assumed to be constant, as price increases supply also increase, as price falls supply also falls. There is direct rela¬tionship between price and supply. The supply curve slopes upwards from left to right.
Question 24.
Equilibrium Price
Answer:
The term ‘equilibrium’ is derived from the latin word ‘acqui’ meaning ‘equal’ and ’libra’ means balance. Thus it means equal balance. A price where supply is equal to the demand in the mar¬ket is called equilibrium price.
Question 25.
Price discrimination.
Answer:
Monopolist will charge different prices for the same commodity or service in the market. This is known as discriminating monopoly or price discrimination.
Question 26.
Contract Rent
Answer:
It is the hire charges tor any durable good. Ex: cycle rent, room rent etc. It is a periodic payment made for the use of any material good. The amount paid by the tenant cultivator to the landlord annually may be also called contract rent. Ex: The rent that a tenant pays to the house owner monthly as per an agreement made earlier or the hiring charges of a cycle per hour is also contract rent.
Question 27.
Gross Profit
Answer:
Gross profit is considered as a difference between total rev¬enue and cost of production. The following are the components of gross profit.
- The rent payable to his own land or buildings includes gross profit.
- The interest payable to his own business capital.
- The wage payable to the entrepreneur for his management includes gross profit.
- Depreciation charges or user cost of production and insurance charges are include in gross profit.
Question 28.
Per capita income
Answer:
It is average income received by a citizen of. a country in a year. We arrive at percapita income by dividing the national income with the population of a country.
Percapita income = \(\frac{National income}{Population}\)
Question 29.
Laissez-faire
Answer:
According to classicals the role of government in economic activities should be nominal or very less. The free play of economic forces it self bring about the fuller utilization of economic resources including labour. Any interference with the free play of market forces under such circumstances the state shall not interfere in economic matter. It should pursue a policy of Laissez-faire policy of non-intervention in economic matters.
![]()
Question 30.
Full Employment
Answer:
Full employment is a situation in which all those who are willing to work at the existing wage rate are engaged in work. The classical economists opened that full employment is the normal situation in the economy.
Question 31.
Overdraft
Answer:
Overdraft is permissable on current account only. The cur¬rent account holders are given the facility overdrafts by which they are allowed to draw an amount above their balances. However they can overdraw the amount upto a certain limit fixed by the bank.
Question 32.
Liquidity
Answer:
Liquidity means the ease with which one can convert a fi-nancial asset into a medium of exchange. Liquidity is greatest for money as an asset into a medium of exchange. It is greatest for money as an asset because money itself is a medium of exchange. Infact money is the only asset which possess perfect liquidity.
Question 33.
Currency
Answer:
Currency consists of paper notes and coins paper notes are issued by the government or the central bank of a country. In India the reserve bank which is the central bank of India issue currency notes at all denominations except one rupee notes. The government of India issue them coins are metallic tokens and are produced in the mints of government.
Question 34.
Near money
Answer:
The near money refers to those highly liquid assets which are not accepted as money but then can be easily converted into I money within a short period. Ex: Saving bank deposit, shares, treasury bills, bonds etc.
![]()
Question 35.
Arithmetic mean.
Answer:
Arithmetic mean of a statistical data is defined as the quo¬tient of the sum of all the items or entries divided by the number of items. Arithmetic mean or simple mean is the most commonly and widely used measured of central tendency.
Question 36.
Pie1 diagram
Answer:
It is also called a pie chart. The circle is divided into many parts as there are components by drawing straight lines from the centre to the circumference.
Question 37.
Bardiagram.
Answer:
Bar diagrams are very commonly used and is better for representation of quantitative data. Bars are simply vertical lines, where the lengths of bars are proportional to their correspond¬ing numerical values.