The strategic use of AP Inter 1st Year Economics Model Papers Set 9 allows students to focus on weaker areas for improvement.
AP Inter 1st Year Economics Model Paper Set 9 with Solutions
Time: 3 Hours
Maximum Marks: 100
Section – A
I. Answer any Three of the following questions in not exceeding 40 lines each. (3 × 10 = 30)
Question 1.
Explain the law of diminishing marginal utility, what are its exceptions.
Answer:
Hermann Heinrich Gossen was the first economist to explain the law of diminishing marginal utility in 1854. It is also known as Gossen’s ‘first law’. In 1890 Marshall in his principles of economics developed and popularised this analysis. This law explains the functional relationship between the stock of commodity the marginal utility of commodity.
According to Marshall “The additional benefit which a person derives from a given increase of his stock thing diminishes with every increase in stock that he already has”. “A consumer increases the consumption of any one commodity keeping constant the consumption of all other commodities the marginal utility of the variable commodity must eventually decline”. Kenneth E. Boulding.
The law says that as we gone consuming a commodity satisfaction derives from its additional units goes on diminishes. Assumptions :
- Rationality: Consumer is a rational man which means he always tries to get maximum satisfaction.
- Cardinal measurement of utility: Utility is a cardinal concept, i.e., utility can be measured and compared numerically.
- Utilities are independent: It implies that utility of any commodity depends as its own quantity.
- Homogeneous : Units of the commodity are similar in quantity, size, taste and colour etc.
- No time gap : There should not be any time gap between the consumption of one unit and other it.
- Constant marginal utility: It is assumed that the marginal utility of money remains constant.
- Total & marginal utility :
- Total utility : Total satisfaction obtained by the consumer from the consumption of a given quantity of commodity.
TUn = f(Qn)
Where TUn = Total utility of n commodity
F = functional relationship
Qn = Quantity of n commodity - Marginal utility: Marginal utility is the addition made to the total utility by consuming one more unit of the commodity.
It can be explained as.
MUn = TUn – TUn-1
MUn = Marginal utility of nth unit
TUn = Total utility of nth unit
TUn-1 = Total utility of n-1 units
MU may also be expressed as follows .
Marginal utility is the additional utility derived from the consumption of an extra unit of commodity.
MU = \(\frac{\Delta \mathrm{TU}}{\Delta \mathrm{C}}\)
Where ΔTU = change in total utility
ΔC = change in number of units consumed.
- Total utility : Total satisfaction obtained by the consumer from the consumption of a given quantity of commodity.
Explanation of the law :
The law of diminishing marginal utility explains the relation between the quantity of good and its marginal utility. If a person goes on increasing his stock of a thing, the marginal utility derived from an additional unit declines. We show this tendericy with an imaginary table given below.
| Unit of x apples | Total utility | Marginal utility |
| 1 | 40 | 40 – 0 = 40 |
| 2 | 70 | 70 – 40 = 30 |
| 3 | 90 | 90 – 70 = 20 |
| 4 | 100 | 100 – 90 = 10 |
| 5 | 100 | 100 – 100 = 0 |
| 6 | 90 | 90 – 100 = -10 |
In this table let us suppose that one is fond of apples. As he consumes one apple after another he derives less and less satisfaction. The first unit consumed with atmost pleasure. For the second, the intensity of his desire diminishes. The third will be still less and so on. The total utility increasing until the consumption of fourth unit of good but diminishing rate. Fifth unit of apple gives him maximum total utility. But marginal utility becomes zero. Further consumption of sixth unit TU diminishes and MU becomes negative. The relationship between total utility and marginal utility is explained in the following three ways.
- When total utility increases at diminishing rate, marginal utility falls.
- When total utility is maximum, marginal utility becomes zero.
- When total utility decreases, marginal utility becomes negative.
This can be shown in the following diagram.
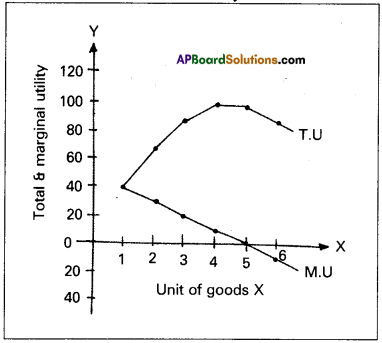
In the diagram on ‘X’ axis measures units of apples and OY axis measures total utility and marginal utility. TU curve represents total utility and MU curve represents marginal utility. TU curve is maximum at 5th unit where MU curve will become zero. TU curve slopes downwards from 6th unit, while MU will become negative.
Limitations or Exceptions :
- Hobbies:
This law does not operate in the case of hobbies like collection of stamps, old paintings, coins etc. Greater the col-lections of a person, greater is his satisfaction. Marginal utility will not diminish. - Drunkers:
It is pointed out that the consumption of liquor is not subject to the law of diminishing marginal utility. The more a person drinks liquor, the more he likes it. - Miser:
This law does not apply to money. The more money a person has the greater is the desire to acquire still more of it. - Further this law does not hold good if any change in in-come of the consumer, tastes and preferences.
![]()
Question 2.
Explain the different forms of price elasticity of demand. Answer: The concept of demand has immerse significance in economics. In general language demand means a desire but in economics the desire backed up by ability to buy and willingness to pay the price.
Types of demands: The demand may be classified into 3 types.
1. Price demand
2. Income demand
3. Cross demand
1) Price demand:
Price demand explains the relation be-tween price and quantity demanded by a commodity it shows the inverse relationship between price and demand when the other things like consumers income, taste etc., remains constant. It means the price falls demand extends and the price raises demand contracts. The price demand can be expressed Dx = f(Px).
- Perfectly elastic demand ( Ed = ∞ )
- Perfectly inelastic demand (Ed = 0)
- Unitary elastic demand (Ed = 1)
- Relatively elastic demand (Ed > 1)
- Relatively inelastic demand (Ed < 1)
1) Perfectly elastic demand: It is also known as “infinite elastic demand”. A small change in price leads to an infinite change in demand is called perfectly elastic demand. It is horizontal straight line to ‘X’ axis. “he numerical value of perfectly elastic demand is infinite (Ed = ∞). Tt can be shown in the diagram.
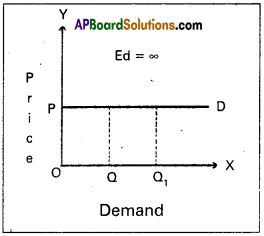
In the diagram, Ed = \(\frac{\mathrm{OQQ}_1^{-}}{\mathrm{OQ}} \div \frac{\mathrm{O}}{\mathrm{OP}}\)
\(\frac{\mathrm{QQ}_1}{\mathrm{OQ}} \times \frac{\mathrm{OP}}{\mathrm{O}}\) = ∞
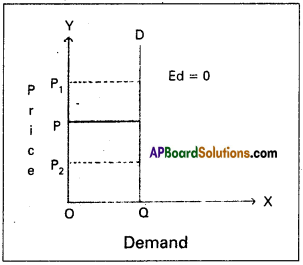
2) Perfectly inelastic demand : It is also known as “zero elastic demand”. In this case even a great rise or fall in price does not lead to any change in quantity demanded is known as perfectly inelastic demand. The demand curve will be vertical to the Y axis. The numerical value is ‘O’. This can be shown in the following diagram.
In the diagram, Ed = \(\frac{\text { Zero }}{\mathrm{OQ}} \div \frac{\mathrm{PP}_1}{\mathrm{OP}}\)
∴ Ed = 0
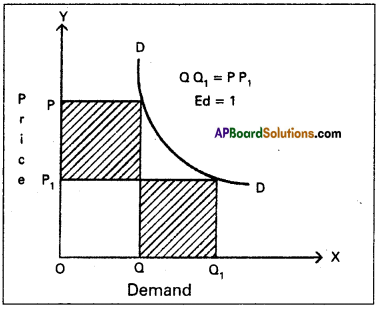
3) Unitary elastic demand :
The percentage change in price leads to same per-centage change in demand is called unitary elastic de-mand. In this case the elasticity of demand is equal to one. The shape of demand curve is “Rectangular Hyperbola”. This can be shown in the following.
In the diagram, Ed = OP1Q1 = OPQ
(or) OQ1 = PP1
∴ Ed = 1
4) Relatively elastic demand : When a percentage change in price leads to more than percentage change in quantity demand is called relatively elastic demand. In this case the numerical value of Ed is greaterthan one (Ed > 1)
In the diagram, Ed = OQ1 > PP1
∴ Ed = 1
5) Relatively inelastic demand: When the percentage change in price leads to a less than percentage change in quantity demand is called relatively inelastic demand. Here the numerical value is less than one (Ed < 1). This can be shown to following diagram.
In the diagram, Ed = QQ1 < PP1
∴ Ed < 1
![]()
Question 3.
State the law of variable proportions with suitable diagram.
Answer:
The law of variable proportions has been developed by the 19th century economists David Ricardo and Marshall. The law is associated with the names of these two economists. The law states that by increasing one variable factor and keeping other factors constant, how to change the level of output, total output first increases at increasing rate, then at a diminishing rate and later decreases. Hence this law is also known as the “Law of diminishing returns”.
Marshall stated in the following words. “An increase in capital and labour applied in the cultivation of land causes in general less than proportionate increase in the amount of produce raised, unless it happens to coincide with an improvement in the arts of agriculture”.
Assumptions :
- The state of technology remain constant.
- The analysis relates to short period.
- The law assumes labour in homogeneous.
- Input prices remain unchanged.
Explanation of the Law :
Suppose a farmer has ‘4’ acres of land he wants to increase output by increasing the number of labourers, keeping other factors constant. The changes in total production, average product and marginal product can be observed in the following table.
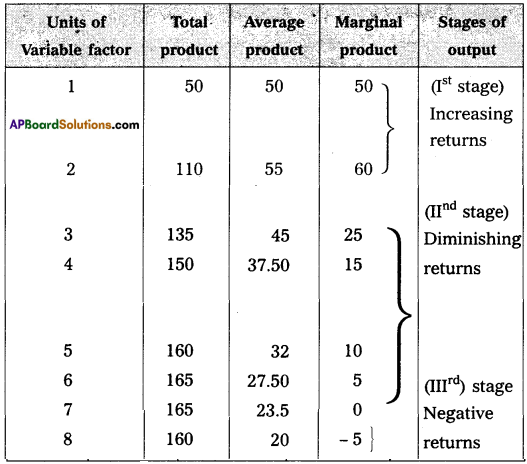
In the above table total product refers to the total output produced per unit of time by all the labourers employed. Average product refers to the product per unit of labour marginal product refers to additional product obtained by employ-ing an additional labour. In the above table there are three stages of production.
1st stage i.e., increasing returns at 2 units total output increases average product increases and marginal product reaches maximum
2nd stage i.e., diminishing returns from 3rd unit onwards TP increases diminishing rate and reaches maximum, MP becomes zero, AP continuously decreases.
3rd stage i.e., negative re¬turns from 8th unit TP decreases AP declines and MP becomes negative. This can be explained in the following diagram.
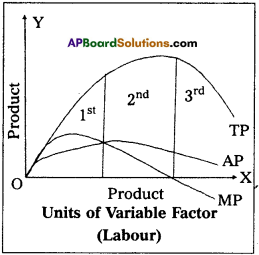
In the diagram on ‘OX’ axis shown units labourer and ‘OY axis show TR MP, and A.P 1st stage TP AP increases MP is maxi-mum. In the 2nd stage TP maximum, AP decrease MP is zero. At 3rd stage TP declines, AP also declines, MP becomes negative.
Question 4.
Explain the price determination under imperfect competition.
Answer:
Monopoly is one of the market in the imperfect competition. The word ‘Mono’ means single and Poly means seller. Thus monopoly means single seller market.
In the words of Bilas “Monopoly is represented by a market situation in which there is a single seller of a product for which there are no close substitutes, this single seller is unaffected by and does not affect, the prices and outputs of other products sold in the economy”. Monopoly exists under the following conditions.
- There is a single seller of product.
- There are no close substitutes.
- Strong barriers to entry into the industry exist.
Features of monopoly:
- There is no single seller in the market.
- No close substitutes.
- There is no difference between firm and industry.
- The monopolist either fix the price or output.
Price determination:
Under monopoly the monopolist has complete control over the supply of the product. He is price maker who can set the price to attain maximum profit. But he cannot do both things simultaneously. Either he can fix the price and leave the output to be determined by consumer demand at a particular price. Or he can fix the output to be produced and leave the price to be determined by the consumer demand for his product. This can be shown iiythe diagram.
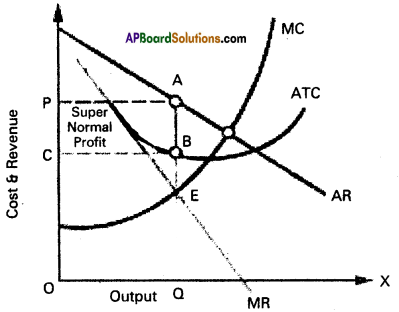
In the above diagram on ‘OX’ Sxis measures output and ‘OY axis measures cost. AR is Average Revenue Curve, AC is Average Cost Curve. In the above diagram at E point where MC = MR at that point the monopolist determine the output price is determine where this output line touches the AR line. In the above diagram for producing OQ quantity cost of production is OCBQ and revenue is OPAQ.
Profit = OPQA – OCBQ = CPAB shaded area.
Question 5.
Describe the various methods of redemption of public debt.
Answer:
Redemption of public debt means repayment of public debt. All government debts should be rapid promptly. There are various methods of repayment which may be discussed under the follow-ing heads.
1) Surplus budget:
Surplus budget means having public revenue in excess of public expenditure. If the government plans for a surplus budget, the excess revenue may be utilized to repay public debt.
2) Refunding:
Refunding implies the issue of fresh bands and securities by government so that the matured loans can be used for repayment of public debt.
3) Annuities:
By this method, the government repays past of the public debt every year. Such annual payments are made regularly till the debt is completely cleared.
4) Sinking fund:
By this method, the government creates a separate fund called ‘Sinking fund’ for the purpose of repaying public debt. This is considered as the best method of redemption.
5) Conversion:
Conversion means that the existing loans are changed into new loans before the date of their maturity.
6) Additional taxation:
Government may resort to addi-tional taxation so as to raise necessary funds to repay public debt under this method new taxes are imposed.
7) Capital levy:
Capital levy is a heavy one time tax on the capital assets and estates.
8) Surplus Balance of payments:
This is useful to repay external debt for which foreign exchange is required surplus bal-ance of payment implies exports in excess of imports by which reserves of foreign exchange can be created.
Section – B
II. Answer any Eight of the following questions in not exceeding 20 lines each. (8 × 5 = 40)
Question 6.
Explain Jacob Viner’s definition of Economics.
Answer:
Jacob Viner’s definition of economics is considered as modem definition of economics. He is an American economist known for his short run and long run cost curve analysis. According to Jacob Viner” Economics is what economists do”. The problem of the economy are.
- What to produce and in what quantities : The economy has to decide whether to produce consumer goods and capital goods. These decisions are influence by individuals as well as government.
- How to produce these goods : A decision has to be made whether to use labour intensive or capital intensive techniques.
- For whom to produce these goods and services : It is concernned with the distribution of income and wealth among different sections of the society.
- How efficient the productive resources are in use : This refers to the efficiency of economic system.
- Whether the available resources are fully utilised : If resources are fully utilised that it can provide more employment opportunities.
- Is the economy growing or static over a period of time.
![]()
Question 7.
Explain the characteristic features of human wants.
Answer:
Human wants are starting point of all economic activities. They depend on social and economic conditions of individuals. Characteristic features of wants :
- Unlimited wants: Human wants are unlimited. There is no end to human wants. When one want is satisfied another want taken its place. Wants differ from person to person time to time and place to place.
- A particular want is satisable: Although a man cannot satisfy all his wants, a particular want canbe satisfied completely in a period of time. Ex : If a person is thirsty he can satisfy it by drinking a glass of water.
- Competition: Human wants unlimited. But the means to satisfy them are limited of scarce. Therefore they complete with each other in priority of satisfaction.
- Complementary: To satisfy a particular want we need a group of commodities at the same time. Ex : Writing need is satisfied only when we have pen, ink and paper together.
- Substitution: Most of our wants can be satisfied by different ways. Ex : If we feel hungry, we take same fo 1 and satisfy this want.
- Recurring: Many wants appear again and again thought they are satisfied at one point of time.
Question 8.
Explain cardinal and ordinal utility approach.
Answer:
The concept of utility was introduce by Benham in 1789. Utility means want satisfying power of a commodity. It is a psychological phenomenon. The measurement of utility, there are two different approaches. 1. Cardinal utility 2. Ordinal utility
1) Cardinal utility:
This approach was developed by Alfred Marshall. According to him utility is psychological concept. So it can be measured ‘util’. The numbers 1,2,3,4 etc are cardinal numbers. According to this analysis the utilities derived from consumption of different commodities can be measured in terms of arbitary units, such as 1, 2, 3 … and so on.
2) Ordinal utility:
This approach was developed by R.J.D. Allen and J.R.Hicks. According to them utility is psychological con-cept. So we cannot measure in numerically much less compared. The numbers 1st, 2nd, 3rd, 4th etc., are ordinal numbers. The ordinal numbers are ranked. It means the utilities obtained by the con¬sumer from different goods can be arranged in a serial order such as 1st, 2nd, 3rd, 4th etc.
Question 9.
What are the properties of Indifference curves.
Answer:
It represents the satisfaction of a consumer from two goods of various combinations.
Properties:
- Indifference curves slopes downwards from left to right there exists negative slope.
- Indifference curves are convex to the origin because of diminishing marginal rate of substitution.
- Indifference curves can never intersect each other.
- Higher indifference curve represent higher level of satis-faction. Indifference curve to the right represents higher satisfaction.
Question 10.
What are the features of perfect competition.
Answer:
Perfect competitive market is one in which the number of buyers and sellers is very large, all engaged in buying and selling a homogeneous products without any restrictions. The following are the features of perfect competition:
1) Large number of buyers and sellers:
Under perfect com-petition the number of buyers and sellers are large. The share of each seller and buyer in total supply or total demand is small. So no buyer and seller cannot influence the price. The price is deter¬mine only demand and supply. Thus the firm is price taker.
2) Homogeneous product:
The commodities produced by all the firm of an industry are homogeneous or identical. The cross elasticity of products of sellers is infinite. As a result, single price will rule in the industry.
3) Free entry and exit:
In this competition there is a free¬dom of free entry and exit. If existing firms are getting profits. New firms enter into the market. But when a firm getting losses, it would leave to the market.
![]()
Question 11.
Explain internal economies.
Answer:
Economies of large scale production can be grouped into two types.
1. Internal economies
2. External economies.
Internal economies :
Internal economies are those which arise from the expan¬sion of the plant, size or from its own growth. These are enjoyed by that firm only. “Internal economies are those which are open to a single factory or a single firm independently of the action of other firms”.
Caimcross
i) Technological economies:
The firm may be running many productive establishments. As the size of the productive establish-ments increase, some mechanical advantages may be obtained. Economies can be obtained from linking process to another pro¬cess i.e., paper making and pulp making can be combined. It also used superior techniques and increased specialization.
ii) Managerial economies:
Managerial economies arises from specialisation of management and mechanisation of managerial functions. For a large size firm it becomes possible for the management to divide itself into specialised departments under specialised personnel. This increases efficiency of management at all levels. Large firms have the opportunity to use advanced techniques of communication, computers etc. All these things help in saving of time and improve the efficiency of the management.
iii) Marketing economies:
The large firm can buy raw ma-terials cheaply, because it buys in bulk. It can secure special con-cession rates from transport agencies. The product can be adver¬tise better. It will be able to sell better.
iv) Financi. onomier: A large firm can arise funds moreeasily and cheaply chan a small one. It can borrow from bankers upon better security.
Question 12.
Explain the components of national income.
Answer:
The total quantity of goods and services produced in the, economy in a year is the national income. The various components of the national income are:
- Consumption (C)
- Gross domestic investment (I)
- Government expenditure (G)
- Net foreign investment (x – m)
1) Consumption:
By consumption, we mean the expendi-ture made on goods and services which directly satisfy our wants. Ex : Cloth, food products, education and health services etc. A major portion of the National Income comprises only consumption goods and services.
Consumption expenditure depends on the level of income. Consumption and savings are the two parts of disposable income. Income which is left after consumption is the saving. Consumption goods can be perishable or durable. Perishable goods are single use goods. Ex : Food. Durable goods can be used more than once for a longer time. Ex : Vehicles, fans etc.
2) Gross domestic investment:
The expenditure made on producer goods by the firms to produce goods and services is the investment expenditure. Ex : Machinery and tools etc. They sat¬isfy wants indirectly. For instance, the plough used for producing rice cannot give us satisfaction directly. Producer goods are most essential for the growth in National Income.
3) Government expenditure:
The expenditure incurred on various goods and services by the government is the public expen-diture. This is what is meant by government nsumption. Gov-ernment provides roads, schools, medical facilities, irrigation, elec-tricity, infrastructure facilities etc., to the society. It also provides administrative-services, defence services etc. The public expenditure is determined by the nature of economic system.
4) Net doreign investment:
Some goods produced in the economy are exported to other countries. In the same way, some goods which are required in the economy are imported into the country. If the value of exports is more than the value of imports, other countries are indebted to our country. So, it must be added to National Income. If the value of imports is more than exports, that difference must be deducted from National Income. Exports – Imports = Net foreign investment National Income = C + I + G + (x – m)
![]()
Question 13.
Explain wage-cut policy.
Answer:
Wage cut policy is one of the assumption of classical theory of employment which was started by ”AC Pigou” who defended the classical theory and its full employment assumption. To Pigou and others the wage fund is given. The wage rate determined by dividing the wage fund with the number of workers. Pigou advocated a general cut in money wages in times of depression to restore full employment.
If there is a problem of unemployment in the economy. It is possible to solve this problem by reducing the money wages of the workers. This is known as “wage cut policy”. The given wage fund can offer more employment at a lower wage rate. The classicals believe that involuntary unemployment all involuntary unemploy-ment would disappear.
Question 14.
Explain the concept of effective demand.
Answer:
Effective demand means where aggregate demand equals the aggregate supply. When aggregate demand is equal to aggregate supply the economy is in equilibrium. This can be shown in the table. ‘
| Level of employment | Aggregate supply price | Aggregate demand price |
| 10 | 500 | 600 |
| 11 | 550 | 625 |
| 12 | 600 | 650 |
| 13 | 650 | 675 |
| 14 | 700 | 700 AD = AS |
| 15 | 750 | 725 |
| 16 | 800 | 750 |
In the table when the level of employment is 14 lakh work¬ers, aggregate demand price is equal to aggregate supply price i.e ₹ 700 crores.
Question 15.
State the contingent functions of money.
Answer:
Money plays a vital role in modern economy.According to Waker’ – “Money is what money does”.
According to ‘Robertson’ – “Anything which is widely ac-cepted in payment for goods discharge of other kinds of business obligations”.
Contingent functions :
a) Measurement and distribution of National income:
National income of a country be measured in money by aggregat-ing the value of all commodities. This is not possible in a barter system “similarly national income can be distributed to different factors of production by making payment then in money.
b) Money equalises marginal utilises/productivities:
The consumers can equalize marginal utilities of different commodi¬ties purchased by them with the help of money. We know how consumers equalize the marginal utility of the taste rupee they speed on each commodity. Similarly firms can also equalize the marginal productivities of different factors of production and maxi¬mize profits.
c) Basis of credit:
Credit is created by banks from out of the primary deposits of money supply of credit, in an economy is de-pendent on the supply of nominal money.
d) Liquidity:
Money is the most important liquid asset. Interms of liquidity it is superior other assets. Money is cent per-cent liquid.
Question 16.
Explain any three definitions of Inflation.
Answer:
Inflation means a general rise in the prices. In the ordinary language it is rapid upward movement of prices in a broder sense, the firm inflation refers to persistent rise in the general price level over a long period of time.
According to Prof.Hawtrey : “Issue of too much currency1″
According to ‘Dalton’: Defined inflation as Too much Money is chasing too few goods”.
According to ’Pigou’: “Inflation exists when money income is expanding more than in proportion to increase in earning activity”.
According to Irving Fisher : “Inflation occurs when the vol-ume of money increases faster than the available supply of goods”.
According to Samuelson : “Inflation denotes a rise in the general level of prices”.
Question 17.
Calculate the median for the following data.

Answer:
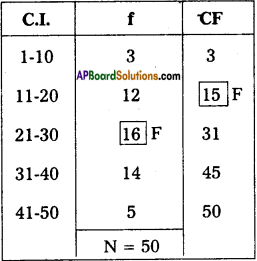
Here N = 50; \(\frac{N}{2}=\frac{50}{2}\) = 25
25th value included in the cumulative frequency 21-30 class intervals.
Lower limit = \(\frac{20+21}{2}=\frac{41}{2}\) = 20.5
F = 15;
f =16;
C = 10
Median = L + \(\left[\frac{\frac{N}{2}-F}{f}\right]\) × C
Median = 20.5 + \(\left(\frac{25-15}{16}\right)\) × 10
= 20.5 + \(\left(\frac{10}{16}\right)\) × 10
= 20.5 + 0.625 × 10
= 20.5 + 6.25 = 26.75
∴ Median = 26.75.
Section – C
III. Answer any fifteen of the following questions in not exceeding 5 lines each. (15 × 2 = 30)
Question 18.
Price
Answer:
The price of anything is its value measured in terms of money i.e., the value of a commodity expressed interms of money. Ex : A commodity is exchanged for ₹ 50/- then the price of commodity is ₹ 50.
Question 19.
Micro economics
Answer:
The word ‘micro’ is a greek word, it means very small. It was developed by Marshall. Micro Economics is also called price theory because it explains pricing in factor market and in product market. It deals with individual units like individual income, individual demand etc.
![]()
Question 20.
Intermediary goods
Answer:
Unfinished and semi-finished goods and good which are under the process of manufacturing are known as intermediate goods. They occupy a stage between raw material and final product. Ex: Wheat flour in the bakery, frying bread are intermediary goods.
Question 21.
Income demand
Answer:
It shows the direct relationship between the income of the consumer and quantity demanded when the other factors remain constant. There is direct relationship between income and supe¬rior goods. Inverse relationship between income and demand for inferior goods. Dx = f(Y)
Question 22.
Ordinal utility
Answer:
This was developed by J.R.Hicks, Allen. Utility is subjective and measurement of utility in numerical terms is not possible. We can observe the preference-one for a good more than for another.
Ordinal numbers such as 1st, 2nd, 3rd etc. The ordinal numbers are ranked.
Question 23.
Equilibrium
Answer:
The point where the consumer gets maximum possible satis-faction, where the budget line is tangent to the indifference curve and the MRS is equal to the price ratio of the two goods will be defined as equilibrium.
Question 24.
Production function
Answer:
Production function is technical concept. It represents func-tional relationship between inputs and the amount of output pro-duced.
Gx = f(L, K, R, N, T)
Question 25.
Supply
Answer:
The quantity of a commodity that a seller is prepared to sell at a particular price and at a particular time is known as supply. The supply curve slopes upwards from left to right.
Question 26.
Marginal cost
Answer:
Marginal cost is the additional cost of production producing one more unit in other words it is the addition made to total cost by producing one more unit of a commodity.
MC = \(\frac{\Delta \mathrm{TC}}{\Delta \mathrm{Q}}\)
Question 27.
Perfect competition
Answer:
In this market large number of buyers and sellers who pro-mote competition. In this market goods are homogeneous. There is no transport fares and publicity costs. So, price is uniform of any market. .
Question 28.
Oligopoly
Answer:
A market with a small number of producer is called oligopoly. The product may be homogeneous or may be differences. This market exists in automobiles, electricals etc.
![]()
Question 29.
Qusi rent
Answer:
The concept of Quasi rent was first introduced by Marshall. According to Marshall is the surplus earned by instruments of production other than land. It is the income earned from man made factors of production. Such as machinery, buildings tools etc. This is shortrun concept.
Question 30.
Money wages
Answer:
Money wages are the remuneration received by the labourer in the form of money for the physical and mental service rendered by him or her in the production process.
Question 31.
GNP
Answer:
Gross National Product (GNP):
It is the total value of all final goods and services produced in the economy in one year.
GNP = C + I + G + (x – m)
where
C = Consumption
I = Gross national investment
G = Government expenditure
X = Exports
m = Imports
x – m = Net foreign trade
Question 32.
Per capita income
Answer:
National income when divided by country’s population. Per capita income is obtained
Per capita Income = \(\frac{National Income}{Total Population}\) The average standard of living of a country is indicated by per capita income.
Question 33.
Deficit budget.
Answer:
Deficit budget arises when the total expenditure in the bud¬get exceeds the total receipts in the budget technically there are four types of deficit budgets.
1) Revenue deficit
2) Budget deficit
3) Fiscal defict
4) Primary defict.
Question 34.
Near money
Answer:
The near money refers to those highly liquid assets which are not accepted as money but then can be easily converted into money within a short period. Ex : Saving bank deposit, shares, treasury bills, bonds etc.
![]()
Question 35.
Demand deposits.
Answer:
The deposits which are payable on demand without any prior notice demand deposits they can be transferred from one person to person. All current deposits are demand deposits.
Question 36.
Overdraft
Answer:
Overdraft is allowed on current account only the current account holders are given the facility overdraft by which they are allowed to draw an amount above their balances.
Question 37.
Bar diagram
Answer:
Bar diagram is very commonly used and is better for representation of quantitative data. Bars are simply vertical lines, where the lengths of bars are proportional to their corresponding numerical values.