The strategic use of AP Inter 1st Year Economics Model Papers Set 10 allows students to focus on weaker areas for improvement.
AP Inter 1st Year Economics Model Paper Set 10 with Solutions
Time: 3 Hours
Maximum Marks: 100
Section – A
I. Answer any Three of the following questions in not exceeding 40 lines each. (3 × 10 = 30)
Question 1.
Explain law of Diminishing marginal utility with the help . of a diagram.
Answer:
Hermann Heinrich Gossen was the first economist to explain the law of diminishing marginal utility in 1854. It is also known as Gossen’s ‘first law’. In 1890 Marshall in his principles of economics developed and popularised this analysis. This law explains the functional relationship between the stock of commodity the marginal utility of commodity.
According to Marshall “The additional benefit which a person derives from a given increase of his stock thing diminishes with every increase in stock that he already has”. “A consumer increases the consumption of any one commodity keeping constant the consumption of all other commodities the marginal utility of the variable commodity must eventually decline”. Kenneth E. Boulding.
The law says that as we gone consuming a commodity satisfaction derives from its additional units goes on diminishes. Assumptions :
- Rationality: Consumer is a rational man which means he always tries to get maximum satisfaction.
- Cardinal measurement of utility: Utility is a cardinal concept, i.e., utility can be measured and compared numerically.
- Utilities are independent: It implies that utility of any commodity depends as its own quantity.
- Homogeneous : Units of the commodity are similar in quantity, size, taste and colour etc.
- No time gap : There should not be any time gap between the consumption of one unit and other it.
- Constant marginal utility: It is assumed that the marginal utility of money remains constant.
- Total & marginal utility :
- Total utility : Total satisfaction obtained by the consumer from the consumption of a given quantity of commodity.
TUn = f(Qn)
Where TUn = Total utility of n commodity
F = functional relationship
Qn = Quantity of n commodity - Marginal utility: Marginal utility is the addition made to the total utility by consuming one more unit of the commodity.
It can be explained as.
MUn = TUn – TUn-1
MUn = Marginal utility of nth unit
TUn = Total utility of nth unit
TUn-1 = Total utility of n-1 units
MU may also be expressed as follows .
Marginal utility is the additional utility derived from the consumption of an extra unit of commodity.
MU = \(\frac{\Delta \mathrm{TU}}{\Delta \mathrm{C}}\)
Where ΔTU = change in total utility
ΔC = change in number of units consumed.
- Total utility : Total satisfaction obtained by the consumer from the consumption of a given quantity of commodity.
Explanation of the law :
The law of diminishing marginal utility explains the relation between the quantity of good and its marginal utility. If a person goes on increasing his stock of a thing, the marginal utility derived from an additional unit declines. We show this tendericy with an imaginary table given below.
| Unit of x apples | Total utility | Marginal utility |
| 1 | 40 | 40 – 0 = 40 |
| 2 | 70 | 70 – 40 = 30 |
| 3 | 90 | 90 – 70 = 20 |
| 4 | 100 | 100 – 90 = 10 |
| 5 | 100 | 100 – 100 = 0 |
| 6 | 90 | 90 – 100 = -10 |
In this table let us suppose that one is fond of apples. As he consumes one apple after another he derives less and less satisfaction. The first unit consumed with atmost pleasure. For the second, the intensity of his desire diminishes. The third will be still less and so on. The total utility increasing until the consumption of fourth unit of good but diminishing rate. Fifth unit of apple gives him maximum total utility. But marginal utility becomes zero. Further consumption of sixth unit TU diminishes and MU becomes negative. The relationship between total utility and marginal utility is explained in the following three ways.
- When total utility increases at diminishing rate, marginal utility falls.
- When total utility is maximum, marginal utility becomes zero.
- When total utility decreases, marginal utility becomes negative.
This can be shown in the following diagram.
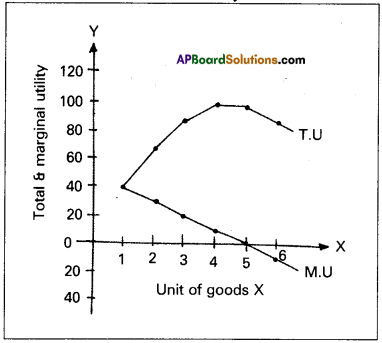
In the diagram on ‘X’ axis measures units of apples and OY axis measures total utility and marginal utility. TU curve represents total utility and MU curve represents marginal utility. TU curve is maximum at 5th unit where MU curve will become zero. TU curve slopes downwards from 6th unit, while MU will become negative.
Limitations or Exceptions :
- Hobbies:
This law does not operate in the case of hobbies like collection of stamps, old paintings, coins etc. Greater the col-lections of a person, greater is his satisfaction. Marginal utility will not diminish. - Drunkers:
It is pointed out that the consumption of liquor is not subject to the law of diminishing marginal utility. The more a person drinks liquor, the more he likes it. - Miser:
This law does not apply to money. The more money a person has the greater is the desire to acquire still more of it. - Further this law does not hold good if any change in in-come of the consumer, tastes and preferences.
![]()
Question 2.
Explain the law of returns to scale with the help of a diagram.
Answer:
The law of returns to scale relate to long run production function. In the long run it is possible to alter the quantities of all the factors of production. If all factors of production are increased in given proportion the total output has to increase in the same proportion.
Ex : The amounts of all the factors are doubled, the total output has to be doubled increasing all factors in the same proportion is increasing the scale of operation. When all inputs are changed in a given proportion, then the output is changed in the same proportion. We have constant returns to scale and finally arises diminishing returns. Hence as a result of change in the scale of production, total product increases at increasing rate, then at a constant rate and finally at a diminishing rate.
Assumptions :
1. All inputs are variable.
2. It assumes that state of technology remain the same. The returns to .scale can be shown in the following table.
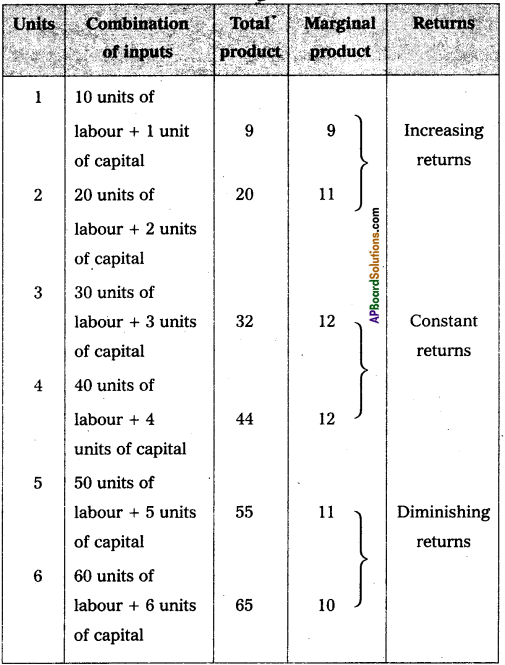
The above table reveals the three patterns of returns to scale. In the 1st place, when the scale is expanded upto 3. units, the returns are increasing. Later and upto 4 units, it remains constant and finally from 5th onwards the returns go on diminishing.
In the diagram on ‘OX’ axis shown scale of production,-on ‘OY’ axis shown total product. RR1 represents increasing returns R1S – Constant returns; SS1 represents diminishing returns.
Question 3.
Define perfect competition and how price of a commodity is determined under perfect competition.
Answer:
Perfect competition is a competition in which the number of buyers and sellers is very large. All enged in buying and selling a homogeneous without any restrictions. Under this competition there are large no. of by buyers and sellers no buyer is a seller can’t influence market price all products are homogeneous there is a freedom of free entry and exit. There is a perfect mobility of factors are production. There is no trans¬port cost these are the main features are perfect competition.
Price determination :
Under perfect competition sellers and buyers can’t decide the price industry decides the price of the good in the supply and demand determined the price these can shown in the following table.
| Price | Quantity supplied | Quantity demanded |
| 1 | 20 | 60 |
| 2 | 30 | 50 |
| 3 | 40 | 40 |
| 4 | 50 | 30 |
| 5 | 60 | 20 |
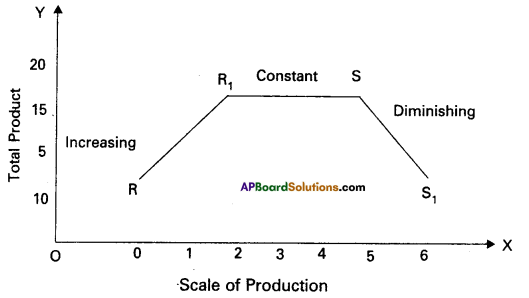
In this competition where demand supply both are equal at that point price and output determine the table changes in price always lead to a change in supply and demand as price increases there is a fall in the quantity demanded. The relation between price and demand is negative. The relation between price and supply is positive. It can be observe the table price ₹ 1 market demand 60 and supply is 20. When price increases ₹ 5 supply increases 60 and demand decreases 20. When the price is ₹ 3 the demand supply are equal that is 40 these price called equilibrium price. This process is explain with help of the diagram.
In the diagram ‘OX’ axis shown demand and supply ‘OY axis represented price. DD de¬mand curve, ‘SS’ is supply curve. In the diagram the demand curve and supply r i ve intersect at point E. Where the price is ‘OP’ and output is ‘OQ’.
Question 4.
What is national income? Explain various methods of measuring it?
Answer:
National Income: National income means the aggregate value of all the fined goods and services produced in the economy in one year. There are three methods of measuring National Income.
- Output method or Product method
- Expenditure method
- Income method
‘Carin cross’ says National Income can be looked in any one of the three ways. As the national income measured by adding up. everybody’s income by adding up everybody’s output and by adding up the value of all things that people buy and adding in th^ir savings.
1) Output method (Product method):
The market value of total goods and services produced in an economy in a year is considered for estimating National Inc’ome. In order to arrive at the value of the product services, the total goods and services produced are multiplied with their market prices.
Then National Income = (P1Q1 + P2Q2 + …. PnQn)
– Depreciation – Indirect taxes + Net income from abroad.
Where P = Price
Q = Quantity
1,2, 3 ……. n = Commodities & services
There is a possibility of double counting. Care must be taken to avoid this. Only final goods and services are taken to compute National Income but not the raw materials or intermediary goods. Estimation of the National Income through this method will indi-cate the contribution of different sectors, the growth trends in each sector and the sectors which are lagging behind.
2) Expenditure method:
In this method we add the per-sonal consumption expenditure of households, expenditure of the firms, government purchase of goods and services net exports plus net income from abroad.
NI = EH + EF + EG + Net exports + Net income from abroad.
Here National Income = Private final consumption expenditure + Government final consumption expenditure + Net domes¬tic capital formation + Net exports + Net income from abroad EH = Expenditure of households EF = Expenditure of firms EG = Expenditure of government
Care should be taken to include spending or expenditure made on final goods and services only.
3) Income method:
In this method, the incomes earned by all factors of production are aggregated to arrive at the National Income of a country. The four factors of production receive in-comes in the form of wages, rent! interest and profits. This is also national income at factor cost.
NI = W+I + R + P + Net income from abroad
NI = National income .
W = Wages
I = Interest
R = Rent
P = Profits
This method gives us National Income according to distrib¬ute shares.
![]()
Question 5.
Explain Keynesian theory of employment.
Answer:
Keynes theory of employment is the principle of effective demand. He called his theory, general theory because it deals with all levels of employment. Keynes explains that lack of aggregate demand is the cause of unemployment. He used the terms aggregate demand, aggregate supply. It means total. The term effective demand is used to denote that level of aggregate demand which is equal to aggregate supply. According to Keynes where aggregate demand and aggregate supply are intersected at that point effective demand is determined. This effective demand will determine the level of employment.
Aggregate supply schedule:
The aggregate supply schedule shows the various amounts of the commodity that will be offered for sale at a series of price. As the level of output increases with the level of employment. The aggregate supply price also increases with every increase in the level of employment. The aggregate supply curve slopes upwards from left to right. But when the economy reaches the level Of the full employment, the aggregate supply curve becomes vertical.
Aggregate demand schedule:
The various aggregate demand prices at different level of employment is called aggregate demand
price schedule. As the level of employment rises, the total income of the community also rises and therefore the aggregate demand price also increases. The aggregate demand curve slopes upward from left to right.
Equilibrium level of income:
The two determinants of effec-tive demand aggregate supply and aggregate demand prices combined schedule is shown in the following table.
| Level of employment (in lakhs of workers) | Aggregate supply price (in crores of ₹) | Aggregate demand price (in crores ₹) |
| 20 | 200 | 175 |
| 30 | 250 | 225 |
| 40 | 300 | 300 AD = AS |
| 50 | 350 | 325 |
| 60 | 400 | 425 |
The table shows that so long as the demand price is higher than the aggregate supply price. The level of employment 40 lakh workers aggregate demand price is equal to aggregate supply price i.e., 300 crores. So, effective demand in the above table is ₹ 300 crores. This can be shown in the following diagrams.
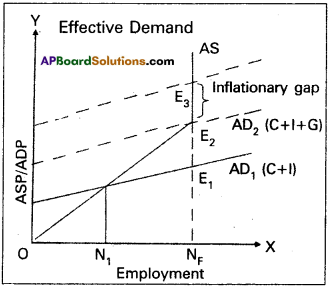
In the diagram ‘X’ axis represents the employment and Y axis represents price. A.S is aggregate supply curve, A.D is aggre gate demand curve. The point of intersection between the two ’E1 & E2‘ points. This is effective demand where all workers are employed at this point the entrepreneurs expectation of profits are maximised. At any other points the entrepreneurs will either incur losses or earn sub-normal profits.
Section – B
II. Answer any Eight of the following questions in not exceeding 20 lines each. (8 × 5 = 40)
Question 6.
Define utility, discuss various types of utility.
Answer:
he want satisfying capacity of a commodity at a point of time is known as utility. Types of utility:
- Form utility :
Form utilities are created by changing the shape, size and colour etc. of a commodity so as to
increase its want satisfying power. Ex : Conversion of a wooden log into a chair. - Place utility:
By changing the place some goods acquire utility. Ex: Sand on the sea shore has no utility. If it is brought out and transported to market, it gains utility. This is place utility. - Time utility:
Time utilities^are created by storage facility. Ex : Business men store food grains in the stock points in the off season and releases them to markets to meet high demand and obtained super normal profits. - Service utility:
Services also have the capacity to satisfy human wants. Ex : Services of Lawyer, Teacher, Doctor etc. These services directly satisfy human wants. Hence they are called as service utilities.
Question 7.
Explain income demand with the help of a diagram.
Answer:
Income demand:
It explains the relationship between consumers income and various quantities of various levels of income assuming other factors like price of goods, related goods, taste etc; remain the same. It means if income increases quantity demand increases and vice versa. This can be shown in the following form.
Dx = f(Y)
The functional relationship between income and demand may be inverse or direct depending on the nature of the commodity. This can be shown in the following table.
| Income | Demand | |
| Superior good | Inferior good | |
| 2000 | 4 | 12 |
| 4000 | 6 | 10 |
| 6000 | 8 | 8 |
| 8000 | 10 | 6 |
| 10,000 | 12 | 4 |
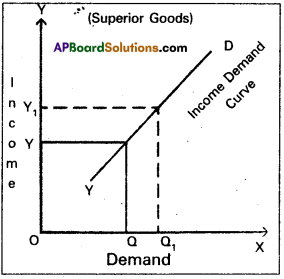
Superior goods:
In case of superior goods quantity demanded will increase when there is an increase in the income of consumers. In the diagram ‘X’ axis represents demand, OY axis represents income, YD represents the income demand curve. It showing positive slope whenever income increased from OY to OY1, the demand of superior or normal goods increases from OQ to OQ1 This may happens in case of Veblen goods.
Inferior goods:
On the contrary quantity demanded of infe-rior goods decreases with the increase in incomes of consumers.
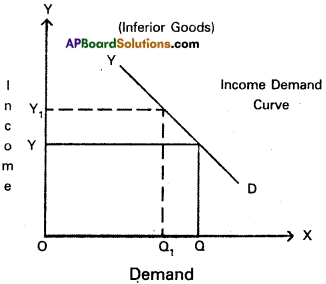
In the diagram on ‘OX’ axis measures demand and OY axis represents income of the consumer. When the consumer income increases from OY to OY1 the demand for a commodity decreases from OQ to OQ1 So the ‘YD’ curve is negative sloping.
Question 8.
What is demand? Why a demand curve has negative slope?
Answer:
According to Marshall “The amount demanded increases with a fall in price and diminishes with rise in remain the same”.The law of demand explains inverse relationship between the price and quantity demanded of a commodity. Therefore the demand curve slopes downward from left to right.
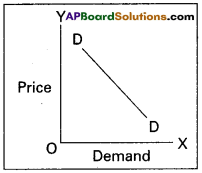
There are some other reasons also responsible for downward sloping demand curve. They are :
1) Old and new buyers :
If the price of good falls, the real income of the old buyers will increase. Hence the demand for the good will increase. In the same way, the fall in price attracts new buyers and will be able to built after a fall in its price. So the demand curve slopes downwards from left to right.
2) Income effect:
Fall in price of commodity the real income of its consumers increase. The increase in real income encourages demand for the commodity with reduced price. The increase in demand an account of increase in real income is known as income effect.
3) Substitution effect:
When the price of commodity falls, it will become relatively cheaper than its substitutes. The increase in demand on account of increased in real income is known as income
4) Law of Diminishing marginal utility :
According to this law, if consumer goes on consuming more units of the commodity, the additional utility goes an diminishing. Therefore, the consumer prefers to buy at a lower price. As a result the demand curve has a negative slope.
![]()
Question 9.
Write the properties of an indifference curve.
Answer:
It represents the satisfaction of a consumer from two goods of various combinations. The important properties of indifference curves are :
- Indifference curves slopes downwards from left to right there exists negative slope.
- Indifference curves are convex to the origin because of diminishing marginal rate of substitution.
- Indifference curves can never intersect each other.
- Higher indifference curve represent higher level of satisfaction. Indifference curve to the right represents higher satisfaction.
Question 10.
Explain the determinants of supply.
Answer:
The supply of a commodity means the total quantity of the commodity that sellers offer to sell at different prices from the stock of that commodity existing at any given time. The supply of commodity depends upon the following factors.
Determinants of supply:
1. Price of the commodity:
The supply of the commodity depends upon the price of that commodity. When price falls, sup-ply falls and when price rises, supply also rises. Thus price and supply are directly related.
2. Factor prices:
The cost of production of a commodity depends upon the prices of various factors of production.
3. Prices of related goods:
The supply of the commodity depends upon the prices of related goods. If the price of a substi-tute good goes up, the producer will be induced to divert their resources.
4. State of technology:
Technological improvements deter-mine supply of a commodity. Progress in technology leads to re-duction in the cost of production which will increase supply.
5. Government policy:
Imposition of heavy taxes as a com-modity discourages its production. Hence production decreases.
Question 11.
Explain the features of oligopoly.
Answer:
The term ‘Oligopoly’ is derived from two Greek words “Oligoi” meaning a few and “Pollein” means to sell. Oligopoly refers to a market situation in which the number of sellers dealing in a homogeneous or differentiated product is small. It is called competition among the few. The main features of oligopoly are the following.
- Few sellers of the product.
- There is interdependence in the determination of price.
- Presence of monopoly power.
- There is existence of price rigidity.
- There is excessive selling cost or advertisement cost.
Question 12.
Mention any three definitions of national income.
Answer:
National Income is the total market value of all goods and services produced in a country during a given period of time. Several economists have defined National Income as follows.
Pigou’s definition :
According Pigou “National Income is that part of the objective income of the community including of course income derived from abroad which can be measured in money”.
Fisher’s definition:
The national dividend or income consists of sole by of services received by ultimate consumers, whether from their material or from their human environment.
Marshall’s definition:
The labour and capital of country acting on its natural resources, produce annually a certain net aggregate of commodities, material and immaterial including services of all kinds. This is the net annual income or revenue of a country.
Kuznet definition:
According to Kuznet’s, “National Income is the net output of commodities and services flowing during the year from the country’s productive system into the hands of ultimate consumers or into the net additional to country’s capital goods”.
![]()
Question 13.
What are the factors that determine real wages?
Answer:
The amount of goods and services that can be purchased with the money wages at any particular time is called real wage. Thus real wage is the amount of purchasing power received by worker through his money wage.
Factors determining the real wage :
1. Methods of form of payment : Besides money wages, normally the labourers get same additional facilities provided by their management. Ex : Free housing, free medical facilities etc. As a result this real wage of the worker will be high.
2. Purchasing power of money: An important factor which determines the real wage is the purchasing power of money which depends upon the general price level. A rise in general price level will mean a full in the purchasing power of money, causes decline in real wages.
3. Nature of work : The working conditions also determine the real wages of labourer. Less duration of work, ventilation fresh air etc., result in high real wages, lack of then facilities real wages are low eventhough money wages are high.
4. Future prospects: Real wage is said to be higher in those jobs where there is possibility of promotions hike in wages and vice-versa.
5. Nature of work : Real wages are also determined by the risk and danger involved in the work. If work is risky wages of labourer will be low though money wages are high. Ex : Captain in a submarine.
6. Timely payment: If a labourer receives payment regularly and timely the real wages of the labourer is high although his money wage is pretty less and vice-versa.
7. Social prestige: Real wage depends on social prestige. The money wages of Bank officer and judge are equal, but the real wage of a judge is higher than bank officer.
8. Period and expenses of education: Period and expenses of training also affect real wages.
Question 14.
Write the sources of public revenue?
Answer:
Revenue received by the government from different sources is called public revenue. Public revenue is classified into two kinds.
1) Tax revenue
2) Non-tax revenue.
1) Tax Revenue:
Revenue received through collection of taxes from the public is called tax revenue. Both the state and central government collect taxes as per their allocation in the constitution. Taxes are two types.
a) Direct taxes:
i) Taxes on income and expenditure.
Ex : Income tax, Corporate tax etc.
ii) Taxes on property and capital assets.
Ex : Wealth tax, Gift tax etc.
b) Indirect taxes : Taxes levied on goods and services.
Ex : Excise duty, Service tax.
2) Non – tax revenue:
Government receives revenue from sources other than taxes and such revenue is called non-tax rev-enue. They are
a) Administrative revenue:
Government receives money for certain; administrative services. Ex : License fee, Tution fee etc.
b) Commercial revenue:
Modem governments establish public sector units to manufacture certain goods and offer certain services. The goods and services are exchanged for the price. So such units earn revenue by way of selling their products. Ex : Indian Oil Corporation, Bharath Sanchar Nigam Ltd, Bharath Heavy Electricals Ltd., Indian Railways, State Road Transport Corporations, Indian Air lines etc.,
c) Loans and advances:
When the revenue received by the government from taxes and from the above non-tax sources is not sufficient to meet the needs of government expenditure, it may receive loans from the financial insti-tutions operating within the country and also from the public. Modem government also taken loans from inter-national financial institutions.
d) Grants-in-aid:
Grants are amount received without any condition of repayment. They are not repaid. These are two types.
1. General grant
2. Specific grant.
Question 15.
Write assuptions of clasical theory of employment?
Answer:
The classical theory of employment is based on the Say’s law of markets. The famous law of markets, propounded by the J.B Say states that “Supply creates its own demand”.
Assumptions: The Say’s law is based on the following as-sumptions.
- There is a free enterprise economy.
- There is perfect competition in the economy.
- There is no government interference in the functioning of the economy.
- The equilibrium process is considered from the long term point of view.
- All savings are automatically invested.
- The interest rate is flexible.
- The wage rate is flexible.
- There are no limits to the expansion of the market.
- Money acts as medium of exchange.
Question 16.
Describe the measures to control inflation?
Answer:
To control the inflation the government has taken various steps. They are :
- Increase the production in the long run.
- Implementing proper monetary and fiscal policies to re-duce the supply of money and credit.
- Controlling prices and eliminating black markets.
- Importing the goods which are scares in supply from out-side countries.
- Introducing rationing and quota system in case of mass consumption of goods.
- Distribution of goods to all the needy sections of the people.
Question 17.
Calculate A.M. in Deviation Method.
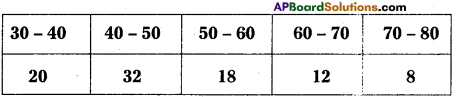
Answer:
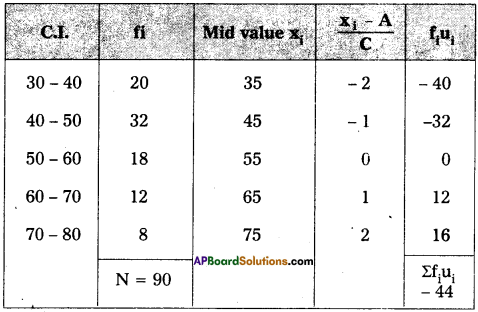
Here calss interval (c) = 10
Assumed mean = 55
Am (or)\(\overline{\mathrm{X}}=\mathrm{A}+\frac{1}{\mathrm{~N}} \Sigma \text { fiui } \times \mathrm{c}\)
= 55 + \(\frac{1}{90}\)(-44) × 10
= 55 + (-4.8)
∴ \(\overline{\mathrm{X}}=50.2\)
Section – C
III. Answer any fifteen of the following questions in not exceeding 5 lines each. (15 × 2 = 30)
Question 18.
Intermediary goods
Answer:
Unfinished and Semi-finished goods and the good which are under the process of manufacturing are known as intermediate goods. They occupy a stage between raw – meterial and final product. Ex: Wheat flour in the bakery, frying bread are intermediary goods.
Question 19.
Deductive method
Answer:
The deductive method is also known as the analytical, abstract and priori method. It proceeds from general to the particular or from universal to the individual. This was advocated by classical economists.
![]()
Question 20.
Partial equilibrium
Answer:
This is also know as particular equilibrium analysis Alfred Marshall popularised this concept. It explains the equilibrium position of a single consumer or single firm or a single industry.
Question 21.
Cardinal utility
Answer:
Alfred Marshall developed cardinal utility analysis. According to this analysis the utilities derived from consumption of different commodities can be measured in terms of arbitary units called util’s cardinal numbers and also can compare the utilities of different commodities.
Question 22.
Budget line
Answer:
The budget line or price shows all possible combinations of two goods that a consumer can buy, with the given income of the consumer and prices of the two goods.
Question 23.
Indifference map
Answer:
A set of indifference curves drawn at different income levels is called as indifference map.
Question 24.
Opportunity cost
Answer:
The concept of opportunity cost was first introduced by Ulerer an Austrian economist. Later it was developed by knight, Davenport, Wicksteod and Robinson. According to Austrian school of economist opportunity cost is the next best alternative sacrificed in order to obtain that commodity.
Question 25.
Marginal revenue
Answer:
Marginal revenue is the additional revenue earned by selling one more unit of the product.
Marginal revenue = \(\frac{change in the total revenue}{change quantity}\)
MR = \(\frac{\Delta \mathrm{TR}}{\Delta \mathrm{Q}}\)
Question 26.
Average product
Answer:
Average production refers to the product per unit of labour. If total product is divided by the number of labour employed we get average product.
Average product = \(\frac{\text { total product }}{\text { number of labour }}\)
Question 27.
Oligopoly
Answer:
A market with a small number of producers is caused oligopoly the product may be homogeneous (or) there may be differences. Since producers are a few each firm produces a large portion of the output. It is a market with competition among the few. This market exists in automobiles, electricals, cigarettes etc.
Question 28.
Price discrimination
Answer:
It is one type of monopoly. Here a monopolist will charge different prices for the same commodity or services in the market to the different buyers. This is known as discriminating monopoly or price discrimination this is not possible in perfect competition.
Question 29.
Quasi rent
Answer:
The Quari-rent concept used by Marshall refers to the short rpn earnings man made factors. They are fixed in supply in the short run when demand for them increases. Their price, therefore the earnings of man made factors like machines and tools in short run depend mainly upon the demand conditions.
![]()
Question 30.
Gross profit
Answer:
In ordinary sense, profit means gross profit. It is the surplus of total revenue total money expenditure incured by a firm after ‘the production process gross profit includes net profit also.
Gross profit = depreciation charges + Cimplicit rent, Implicit wage and Implicit interest) + Normal profit + Changes of gains + Net profit
Question 31.
Disposable income
Answer:
Disposable income is that part of personal income which is left with the individual after payment of all direct taxes like income tax. Property, tax etc. generally disposable income is either spent for consumption. Reserving the remainder for savings.
DI = PI – personal taxes DI = consumption + savings.
Question 32.
Per capita income
Answer:
It is the average income received by a citizen of country in a year. We arrive per capita income by dividing the national income with the population of a country. Per capita income is the real measure of the welfare of the people. A rise in the per capita (real) income indicates an improvement in the economic position of the people.
Per capita income = \(\frac{\text { National income }}{\text { Population }}\)
Question 33.
Deficit budget
Answer:
Deficit budget arises when the total expenditure in the budget exceeds the total receipts in the budget.
Question 34.
Over draft
Answer:
This is a facility allowed by the bank to the current account holder. Sometimes they are allowed to draw and amount above the balances in their account they can over draw the amount upto a certain limit fixed by the banks.
Question 35.
Recurring deposits
Answer:
People will deposits their money in these deposits as monthly installements for fixed period of time. A fixed amount in the multiples of ? 10 may be deposited every month for a period one or more years. These deposits carry interest at a rate more than that of savings deposits.
Question 36.
Cost push inflation
Answer:
Inflation caused by the rise in cost of production is called cost push inflation cost of production may rise due to the increase in wages forced by the trade unions or government. Increase in the rent, interest rate prices of raw materials etc., also results in increases in the cost of production.
Question 37.
Bar diagram
Answer:
Bar diagram: Bars are simply vertical lines, where the lengths of bars are proportional to their corresponding numerical values.