The strategic use of AP Inter 1st Year Economics Model Papers Set 8 allows students to focus on weaker areas for improvement.
AP Inter 1st Year Economics Model Paper Set 8 with Solutions
Time: 3 Hours
Maximum Marks: 100
Section – A
I. Answer any Three of the following questions in not exceeding 40 lines each. (3 × 10 = 30)
Question 1.
State and explain the law of equi-marginal utility.
Answer:
Law of equi-marginal utility is an important law of consumption. It is called as “Gossen’s with the name of H.H.Gossen. According to Marshall “If person has a thing which can be put to several uses, he will distribute it among these uses in such a way that it has the same marginal utility in-all uses. If it had a greater marginal utility in one use than in another, he would gain by taking away some of it from the second and applying it to the first”.
According to this law the consumer has to distribute his money income on different uses in such a manner that the last rupee spent on each commodity gives him the same marginal util¬ity. Equalisation of marginal utility in different uses will maximise his total satisfaction. Hence this law is known as “law of equi-mar¬ginal utility”.
Assumptions of the law : The law of equi-marginal utility depends on the following assumptions.
- This law is based on cardinal measurement of utility.
- Consumer is a national man always aiming at maximum satisfaction.
- The marginal utility of money remains constant.
- Consumer’s income is limited and he is proposed to spent the entire amount on different goods.
- The price of goods are unchanged.
- Utility derived from one commodity is independent of the utility of the other commodity.
The fundamental condition for consumer’s equilibrium can be explained in the following way.
\(\frac{\mathrm{MU}_{\mathrm{x}}}{\mathrm{P}_{\mathrm{x}}}=\frac{\mathrm{MU}_{\mathrm{y}}}{\mathrm{P}_{\mathrm{y}}}=\frac{\mathrm{MU}_{\mathrm{z}}}{\mathrm{P}_{\mathrm{z}}}\) = MUm
Where MUX, MUy, MUz, MUm marginal utility of commodi-ties X, Y, Z, m;
pX Py, Pz = prices of X, y, z.
This law can be explained with the help of a table. Suppose the consumer is prepared to spend his money income is ₹ 26/- on two goods x and y. Market prices of two goods are ₹ 4/- & ₹ 5/-respectively. Now the marginal utilities of goods x & y are shown below.
| Units UX | MUX | Units Uy | MUy |
| 1 | 44 | 1 | 45 |
| 2 | 40 | 2 | 40 |
| 3 | 36 | 3 | 35 |
| 4 | 32 | 4 | 30 |
| 5 | 28 | 5 | 25 |
For explaining consumer’s maximum satisfaction and consequent equilibrum position we need to reconstruct the above table by dividing marginal utilities of x its price ₹ 4/- and marginal utility of y by ₹ 5/-. This is shown in the following table.
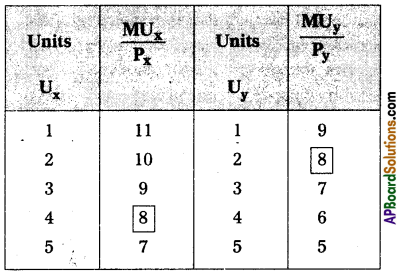
In the table it is clear that when consumer purchase 4 units of goods x & 2 units of good y. Therefore, consumer will be in equilibrium when he is spending (4 × 4 = 16 + 2 × 5 = 10) ₹ 26 on them. Consumer’s equilibrium may be shown in the diagram.
In the diagram marginal utility curves of goods slope downwards i.e. AB & CD taking the income of the consumer as given, suppose his of money constant at OE. \(\frac{\mathrm{MU}_{\mathrm{x}}}{\mathrm{P}_{\mathrm{x}}}\)is equal to OE when OG quantity of good X is brought. \(\frac{\mathrm{MU}_{\mathrm{y}}}{\mathrm{P}_{\mathrm{y}}}\)
is equal to OE, when OF quantity of good y is purchased. Thus consumer purchasing OG of X and OF of Y.
\(\frac{\mathrm{MU}_{\mathrm{x}}}{\mathrm{P}_{\mathrm{x}}}=\frac{\mathrm{MU}_{\mathrm{y}}}{\mathrm{P}_{\mathrm{y}}}\) = MUm This is consumer’s equilibrium.
![]()
Question 2.
Explain the law of variable proportions with suitable diagram.
Answer:
The law of variable proportions has been developed by the 19th century economists David Ricardo and Marshall. The law is associated with the names of these two economists. The law states that by increasing one variable factor and keeping other factors
constant, how to change the level of output, total output first increases at increasing rate, then at a diminishing rate and later decreases. Hence this law is also known as the “Law of Diminishing returns”. Marshall stated in the following words.
“An increase in capital and labour applied in the cultivation of land causes in general less than proportionate increase in the amount of produce raised, unless it happens to coincide with an improvement in the arts of agriculture”.
Assumptions :
- The state of technology remain constant.
- The analysis relates to short period.
- The law assumes labour in homogeneous.
- Input prices remain unchanged.
Explanation of the Law:
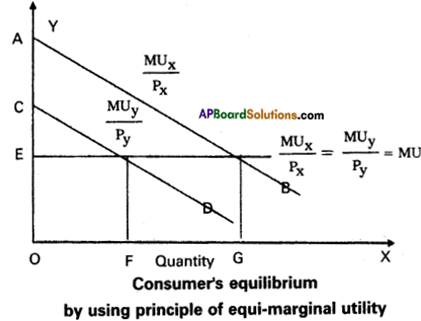
Suppose a farmer has ‘4’ acres of land he wants to increase output by increasing the number of labourers, keeping other factors constant. The changes in total pro-duction, average product and marginal product can be observed in the following table.
In the above table total product refers to the total output produced per unit of time by all the labourers employed. Average product refers to the product per unit of labour marginal product refers to additional product obtained by employ-ing an additional labour. In the above table there are three stages of production.
1st stage i.e., increasing returns at 2 units total output increases average product increases and marginal product reaches maximum.
2nd stage i.e., diminishing returns from 3rd unit onwards TP increases diminishing rate and reaches maximum, MP becomes zero, AP continuously decreases.
3rd stage i.e., negative returns from 8th unit TP decreases AP declines and MP becomes negative. This can be explained in the following diagram
In the diagram on ‘OX’ axis shown units labourer and ‘OY axis show TP, MP and A.P. 1st stage TP, AP increases MP is maxi-mum. In the 2nd stage TP maximum, AP decrease MP is zero. At 3rd stage TP declines, AP also declines, MP becomes negative.
Question 3.
How is price determined under imperfect competition market?
Answer:
Monopoly is one of the market in the imperfect competition. The word Mono’ means single and Poly means seller. Thus monopoly means single seller market. In the words of Bilas “Monopoly is represented by a market situation in which there is a single seller of a product for which there are no close substitutes, this single seller is unaffected by and does not affect, the prices and outputs of other products sold in the economy”. Monopoly exists under the following conditions.
1) There is a single seller of product.
2) There are no close substi-tutes.
3) Strong barriers to entry into the industry exist.
Features of monopoly:
- There is no single seller in the market.
- No close substitutes.
- There is no difference between firm and industry.
- The monopolist either fix the price or output.
Price determination:
Under, monopoly the monopolist has complete control over the supply of the product. He is price maker who can set the price to attain maximum profit. But he canndt do both things simultaneously. Either, he can fix the price and leave the output to be determined by consumer demand at a particular price. Or he can fix the output to be produced and leave the price to be determined by the consumer demand for his product. This can be shown in the diagram.
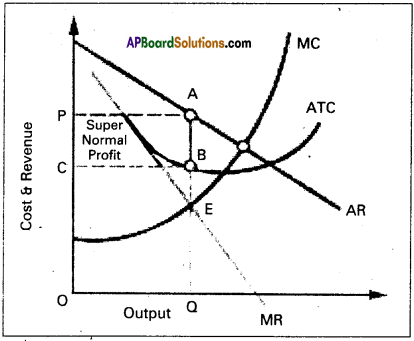
In the above diagram on ‘OX’ axis measures output and ‘OY axis measures cost. AR is Average Revenue curve, AC is Average Cost curve. In the above diagram at E point where MC = MR at that point the monopolist determine the output. Price is determine where this output line touches the AR line. In the above diagram for producing OQ quantinity cost of production is OCBQ and rev¬enue is OPAQ.
Profit = Revenue – Cost
= PACB shaded area
Question 4.
Describe the various concepts of National income.
Answer:
National Income means the aggregate value of all the final goods and services produced in the economy in one year.
Concepts of National Income :
1) Gross National Product (GNP): It is the total value of all final goods and services produced in the economy in one year. The main components of GNP are:
a) The goods and services purchased by consumers – C.
b) Investments made by public and private sectors -1.
c) Government expenditure on public utility services – G.
d) Incomes earned through International Trade (x – m).
e) Net factor incomes from abroad.
GNP at market prices = C + I – G + (x – m) + Net factor income from abroad.
2) Gross Domestic Product (GDP): The market value of the total goods and services produced in a country in one particular period usually in a year is the GDP
GDP = C + I + G
3) Net National Product (NNP):
Firms use continuously machines and tools for the production of goods and services. This result in a loss of value due to wear and tear of fixed capital. The loss suffered by fixed capital is called depreciation. When we substract depreciation from GNP we get NNP. NNP = GNP – depreciation.
4) National Income at factor cost:
The cost of production of a good is equal to the rewards paid to the factors which partici¬pated in the production process. So the cost of production of a firm is the rent paid land, wages paid labour, interest paid on capital and profits of the entrepreneur. National Income at factor cost = NNP + Subsidies – Indi-rect Taxes – Profits of Govt, owned firms.
5) Personal Income:
It is the total of incomes received by all persons from all sources in a specific time period. Personal income is not equal to National Income. Because social security payments. Corporate taxes, undistributed profits are deducted from national income and only the remaining is received by persons.
Personal Income = National Income at factor cost – Undis-tributed profits – Corporate taxes – Social security contributions + Transfer payments.
6) Disposable income:
Personal income totally is not avail-able for spending income tax is a payment which must be deducted to obtain disposable income.
Disposable income = Personal income – Personal taxes
D.I = Consumption + Savings
7) Per capita income:
National Income when divided by country’s population. We get per capita income.
Per capita income = \(\frac{National Income }{Total Population}\)
The average standard of living of a country is indicated v per capita income.
![]()
Question 5.
Explain the Keynesian theory of employment.
Answer:
Keynes theory of employment is the principle of effective demand. He called his theory, general theory because it deals with all levels of employment. Keynes explains that lack of aggregate demand is the cause of unemployment. He used the terms aggregate demand, aggregate supply. It means total. The term effective demand is used to denote that level of aggregate demand which is equal to aggrerate supply.
According to Keynes where aggregate demand and aggregate supply are intersected at that point effective demand is determined. This effective demand will determine the level of employment.
Aggregate supply schedule:
The aggregate supply schedule shows the various amounts of the commodity that will be offered for sale at a series of price. As the level of output increases with the level of employment. The aggregate supply price also increases with every increase in the level of employment. The aggregate supply curve slopes upwards from left to right. But when the economy reaches the level of the full employment, the aggregate supply curve becomes vertical.
Aggregate demand schedule:
The various aggregate demand prices at different level of employment is called aggregate demand price schedule. As the level of employment rises, the total income of the community also rises and therefore the aggregate demand price also increases. The aggregate demand curve slopes upward from left to right.
Equilibrium ‘evel of income:
The two determinants of effective demand aggregate supply and aggregate demand prices combined schedule is shown in the following table.
| Level of employment – (in lakhs of workers) | Aggregate- supply price (in mores of f) | Aggregate demand price (in crores of T) |
| 20 | 200 | 175 |
| 30 | 250 | 225 |
| 40 | 300 | 300 AD = AS |
| 50 | 350 | 325 |
| 60 | 400 | 425 |
The table shows that so long as the demand price is higher than the aggregate supply price. The level of employment 40 lakh workers aggregate demand price is equal to aggregate supply price i.e., 300 crores. So effective demand in the above table is ₹ 300 crores. This can be shown in the following diagrams.
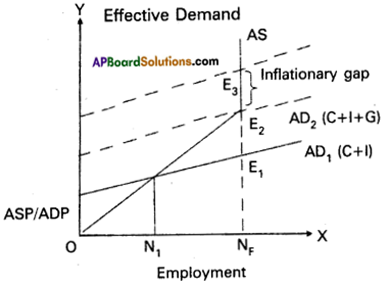
In the above diagram ‘X’ axis represents the employment and Y axis represents price. A.S is aggregate supply curve A.D is ag-gregate demand curve. The point of intersection between the two Ej & E2 points. This is effective demand whe^e all workers are employed at this point the entrepreneurs expc. ation of profits are maximised. At any other points the entrepreneurs will either incur losses or earn sub-normal profits.
Section – B
II. Answer any Eight of the following questions in not exceeding 20 lines each. (8 × 5 = 40)
Question 6.
Explain the law of Demand.
Answer:
Demand means the desire backed by necessary purchasing power of a commodity. It is mainly depending on the following factors, they are :
- Desire for the commodity
- Ability to buy the commodity
- Willing to pay the price of commodity
- Demand is always at a price
- Demand is per unit of time i.e, per day, week etc. Therefore the price demand may be expressed in the form of small equation. Dx = f(Px)
Price demand explains the relation between price and quantity demanded of a commodity. Price demand states that there is an inverse relationship between price and demand.
Law of demand:
Marshall defines the law of demand as, “The amount demanded increases with a fall in price and dimin-ishes with arise in price when other things remain the same”. So, the law of demand explains the inverse relationship between the price and quantity demanded of a commodity.
Demand schedule:
It means a list of the quantities demanded at various prices in a given period of time in a market. An imagi-nary example given below.
| Price in? | Quantity Demanded units |
| 5 | 10 |
| 4 | 20 |
| 3 | 30 |
| 2 | 40 |
| 1 | 50 |
The table shows that as the price falls to ₹ 1/- the quantity demanded 50 units, when price ₹ 5/- he is buying 10 units. So, there is inverse relationship between price and demand. Price is low demand will be high and price is high de¬mand will be low. We can illustrate the above schedule in a diagram.
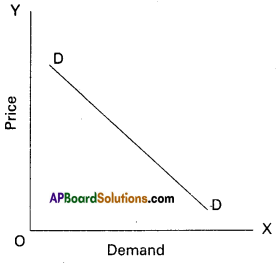
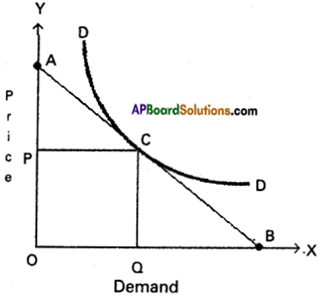
In the above diagram on X-axis demand is shown and price is on Y-axis. DD is the demand curve. Demand curves slopes downward from left to right.
Assumptions:
- No Change in the income of consumer
- The taste and preferences consumers remain same.
- The prices of related goods remain the same.
- New substitutes are not discovered.
- No expectation of future price changes.
Exceptions:
In certain situations, more will be demanded at higher price and less will be demanded at a lower price. In such cases the demand curve slopes up¬ward from left to right which is called an-exceptional demand curve. This can be shown in the fol-lowing diagram.
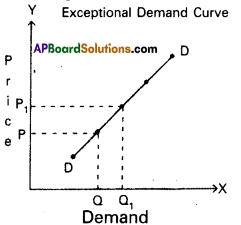
In the diagram when price increases from OP to OPp demand also increases from OQ to OQr This is opposite to law of demand.
1) Giffen’s Paradox:
This was stated by Sir Robert Giffen. He observed that poor people will demand more of inferior goods, if their prices raise. Inferior goods are known as Giffen goods. Ex : Ragee, Jowar etc. He pointed out that in case of the English workers, the law of demand does not apply to bread. Giffen noticed that workers spend a major portion of their income on bread and only small portion on meat.
2) Veblen Effect (Prestigious goods):
This exception was stated by Veblen. Costly goods like diamonds and precious stones are called prestige goods or veblen goods. Generally rich people purchase those goods for the sake of prestige. Hence rich people may buy more such goods when their prices rise.
3) Speculation:
When the price of a commodity rises the group of speculators expect that it will rise still further. Therefore, they buy more of that commodity. If they expect that there is a fall in price, the demand may not expand. Ex : Shares in the stock market.
4) Illusion:
Some times, consumer develop to false idea that a high priced good will have a better quality instead of low priced good. If the price of such good falls, demand decreases, which is contrary to the law of demand.
![]()
Question 7.
What is a budget line.
Answer:
The budget line or price line shows all possible combinations of two goods that a consumer can buy with the given income of the consumer and prices of the two goods.
The concept of budget / price line will be shown in the following example. Suppose that a consumer has ₹ 150 (income) to buy two goods namely X and Y. Whose prices are ₹ 15 and ₹ 30 each. With the given information now we can draw the budget or price line as shown in the diagram. In the above diagram ‘AB’ is the ‘budget or price line’. The slope of the line AB represents the ratio of the prices of X and Y in such a manner that 10 of x will be equal to 5 of y.
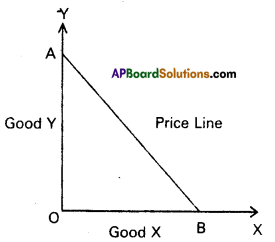
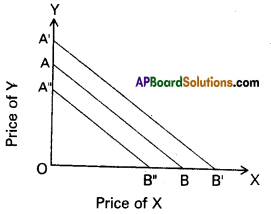
Shifts in the Budget line :
The position of the budget line depends upon size of money income of the consumer. If his income increase and the price of the two commodities remaining the same, the con¬sumer can buy more of both the commodities. On the other hand, if his income decreases, the prices of the two commodities remaining the same the consumer now to reduce his purchase. As a result of changes in the consumer income, there will be shifts in budget line also. The same is shown in the following diagram.
Question 8.
What are the various types of price elasticity of Demand. Answer: Price elasticity of demand relates to the responsiveness of quantity of commodity demanded to the change in its price.
Ep = \(\frac{Proportionate change in demand }{Proportionate change in price }\)
Types of Price elasticity of demand : Based on the numeri-cal value, price elasticity of demand can be
- Perfectly elastic demand (Ed = ∞)
- Relatively elastic demand (Ep > 1)
- Relatively inelastic demand (Ep < 1)
- Unitary elastic demand (Ep = 1)
- Perfectly inelastic demand (Ep = 0)
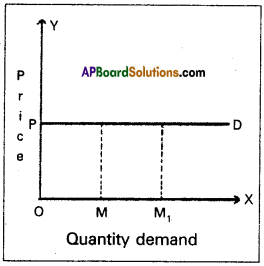
1) Perfectly elastic de-mand:
It is a negligible change in price leads to an infinitive change in demand in said to be perfectly elastic demand. In this case the demand curve is a hori-zontal straight line to x’ axis.
Ep = \(\frac{\mathrm{MM}_1}{\mathrm{OM}} \div \frac{\mathrm{O}}{\mathrm{OP}}\)
= \(\frac{\mathrm{MM}_1}{\mathrm{OM}} \times \frac{\mathrm{OP}}{\mathrm{O}}\) = ∝
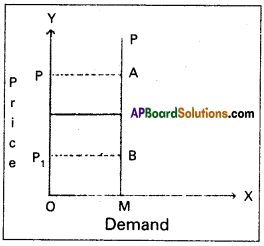
2) Perfectly inelastic de-mand:
If there is a any change in price does not lead any change in quantity demand is known as perfectly inelastic demand.
Ep = \(\frac{\mathrm{MM}_1}{\mathrm{Om}} \div \frac{\Delta \mathrm{p}}{\mathrm{p}}\)
Ep = \(\frac{\text { zero }}{\mathrm{OM}} \div \frac{\Delta \mathrm{p}\left(\mathrm{pp_{1 } )}\right.}{\mathrm{OP}}\) = 0
∴ Ep = 0
3) Unitary elastic demand:
If the proportinate change price leads to the same proportionate change in quantity demand is called unitary elastic demand. In this the Ed = 1. The demand curve is rectangular hyperbola
Here OP1 = BM1
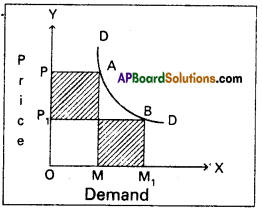
4) Relatively elastic demand : When a proportionate change in price leads to a more than proportionate change in de- mand is called relatively elastic demand
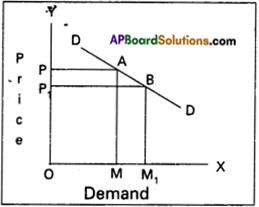
In this case Ed = > 1. The diagram shows small change in price PP1 resulted in a great change in demand (MM1)
OP1BM1 = OPAM.
5) Relatively inelastic demand:
When a proportianate change in price leads to a less than proportionate change in demand is called relatively inelastic demand. In this case Ed is < 1.
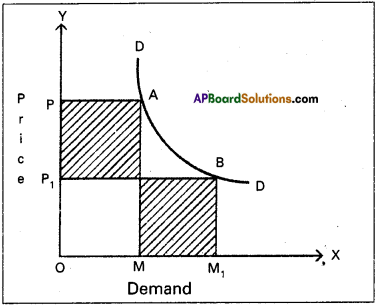
In the diagram, BM1 < OPAM ∴ Ep < 1.
Question 9.
How do you measure elasticity of Demand on straight line demand curve.
Answer:
Point method : This method is introduced by Marshall. In this method elasticity of demand is measured at a point on the demand curve. Sp, this method is also called as “geometrical
method”. In this method to measure elasticity at a point on demand curve the following formula is applied.
Ed = \(\frac{The distance from the point to the X – axis}{The distance from the point to the Y – axis}\)
In the below diagram ‘AE’ is straight line demand curve. Which is 10 cm length.
Applying the formula we get
Ed = 1
Ed < 1
Ed = 0
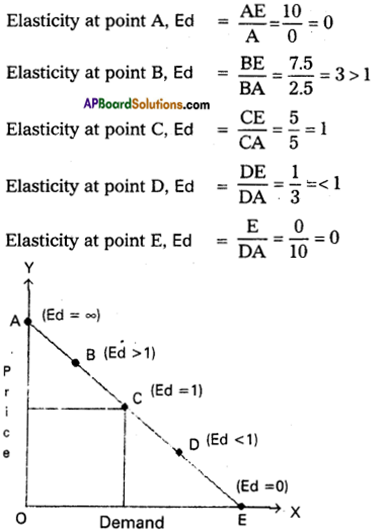
If the demand curve is non-linear. It means if the demand curve is not straight line will be drawn at the point on the demand curve where to measure elasticity.
In the diagram at C point where Elasticity of demand will be equal to ^5..
![]()
Question 10.
What is production function.
Answer:
Production function is technical concept. It explains the physical relationship between input and output at any period of time. It represents functional relationship between inputs and the amount of output produced. According to Stigler “Production is the name given to the relationship between rates of inputs of productive services and the rate of output of product”. The production function can be expressed mathematically as follows.
Gx = f (L, K, R, N, T)
Gx = Output
f = Functional relationship
L = Amount of Labour
K = Amount of Capital
R = Raw material
N = Natural resources or land
T = State of Technology.
Where Gx is dependent variable and is determined by the inputs used, whereas L, K, R, N, T are independent variables.
Question 11.
What are the features of monopoly.
Answer:
Monopoly is one of the market in the imperfect competition. The word ‘Mono’ means single and Poly means seller. Thus monopoly means single seller market. In the words of Bilas “Monopoly is represented by a market situation in which there is a single seller of a product for which there are no close substitutes, this single seller is unaffected by and does not affect, the prices and outputs of other products sold in the economy”. Monopoly exists under the following conditions.
- There is a single seller of product.
- There are no close substi-tutes.
- Strong barriers to entry into the industry exist.
Features of monopoly:
- There is no single seller in the market.
- No close substitutes.
- There is no difference between firm and industry.
- The monopolist either fix the price or output.
Question 12.
“Supply water it’s own demand” comment on the statement. Answer: Classical theory of employment or the theory of output and employment developed by economists such as Adam Smith, David Ricardo, Robert Malthus etc., it is based on the J.B Say’s law of market’. According to this law “supply creates its own demand”. The classical theory of employment assumes that there is always full employment of labour and other resources.
According to this law the supply always equals to demand it can be expressed as S = D. Whenever additional output is produced in the economy. The factors of production which participate in the process of production. Earn income in the form of rent, wages, interest and profits.
The total income so generated is equivalent to the total value of the additional output produced. Such income creates addition demand necessary for the sale of the additional output. Therefore the question of addition output not being sold does not arise.
Question 13.
Describe various methods of redemption of public debt.
Answer:
Redemption of public debt means repayment of public debt. All government debts should be rapid promptly. There are various methods of repayment which may be discussed under the following heads
1) Surplus budget:
Surplus budget means having public revenue in excess of public expenditure. If the government plans for a surplus budget, the excess revenue may be utilized to repay public debt.
2) Refunding:
Refunding implies the issue of fresh bands and securities by government so that the matured loans can be used for repayment of public debt.
3) Annuities:
By this method, the government repays past of the public debt every year. Such annual payments are
made regu¬larly till the debt is completely cleared.
4) Sinking fund:
By this method, the government creates a separate fund called ‘Sinking fund’ for the purpose of repaying public debt. This is considered as the best method of redemption.
5) Conversion:
Conversion means that the existing loans are changed into new loans before the date of their maturity.
6) Additional taxation:
Government may resort to additional taxation so as to raise necessary funds to repay public debt under this method new taxes are imposed.
7) Capital levy:
Capital levy is a heavy one time tax on the capital assets and estates.
8) Surplus Balance of payments:
This is useful to repay external debt for which foreign exchange is required surplus bal-ance of payment implies exports in excess of imports by which reserves of foreign exchange can be created.
Question 14.
State the types of Inflatioii.
Answer:
Inflation means a general rise in prices. Based on the rate of inflation, it may be divided into four types.
- Creeping inflation: When rise in the prices is very slow and small, it is called creeping inflation.
- Walking inflation: This is the second stage of inflation. The inflation rate will be between 2% and 4%.
- Running inflation: When the rate of inflation is in the range of 4-10% per annum, it is called running inflation.
- Galloping inflation or hyper inflation: If the inflation rate exceeds 10%, galloping inflation occurs. It may also called hyper inflation.
![]()
Question 15.
Examine the difficulties of the barter system.
Answer:
Barter system means exchange of goods. This system was followed in old days. But the population and its requirements are increasing, the system became very complicated. The difficulties of barter system are:
1) Lack of coincidence of wants:
Under the barter system, the buyer must be willing to accept the commodity which the seller is willing to offer in exchange. The wants of both the buyer and the seller just coincide. This is called double coincidence of wants. Suppose the seller has a good and he is willing a exchange it for rice. Then the buyer must have rice and he must be willing to exchange rice for goat. If there is no such coincidence direct exchange between the buyer and the seller is not possible.
2) Lack of store value:
Some commodities are perishables. They perish within a short time. It is not possible to store the value of such commodities in their original form under the barter system. They should be exchanged before they actually perish.
3) Lack of divisibility of commodities:
Depending upon its quantity and value, it may become necessary to divide a commodity into small units and exchange one or more units for other com¬modity. But all commodities are not divisible.
4) Lack of common measure of-value: Under the barter system, there was no common measure value. To make exchange possible, it was necessary to determine the value of every com¬modity interms every other commodity.
5) Difficulty is making deferred payments:
Under barter system furture payments for present transaction, was not pos¬sible, because future exchange involved some difficulties. For ex¬ample suppose it is agreed to sell specific quantity of rice in ex¬change for a goat on a future date keeping in view the recent value of the goat. But the value of goat may decrease or increase by that date.
Question 16.
Explain the different kinds of deposits accepted by the Commercial Banks.
Answer:
Commercial banks pay a very important role in the economic growth of a country. Commercial banks are the most important source of institutional credit in the money market. Banks attract savings from the people and encourage investment in industry, trade and commerce. Bank is a profit seeking business firm dealing in money and credit.
The word bank is derived from the “German” word “bankco” which means joint stock or joint fund. Banking in Britain originated with the lending of money by wealthy individuals to merchants who wished to borrow.
According to Richard Sydney’ sayers: “Banks are institu¬tions whose debts usually referred to as “Bank deposits” are commonly accepted in final settlement of other people’s debts”.
Accepting deposits:
The commercial bank just like any other money lender is doing money lending business. Bank receives public money in the form of deposits. The deposits mainly are of the following types.
a) Current deposits: These’deposits have two characteristics.
1) There are no restrictions with regard to the amount of withdrawal and number of withdrawals.
2) Banks normally do not pay .any interest on current account deposits.
b) Savings deposits: The sole aim of banks in receiving these
deposits is to promote the habit of thrift among low income groups. They have the following characteristics :
1) Two or three withdrawals per week are permitted.
2) Banks pay 4% to 5% interest per annum on savings deposits.
c) Recurring deposits: People will deposit their money in these deposits as monthly installments for a fixed period of time. The bank after expiry of the said period will return the total amount with interest thereon. The rate of interest will be higher than the saving deposits.
d) Fixed deposits: Deposits are fixed accounts are called fixed or time deposits they are left with the bank for a fixed period. The following are the characteristics.
1) The amount cannot be withdrawn before expiry of fixed period.
2) Bank pay high rate of interest than any deposits.
Question 17.
Explain the Geomatric diagram? What are Bar diagram and Pie diagram.
Answer:
Diagrams are more suitable to illustrate the data which is discrete, while continuous data is better represented by graphs. BAR DIAGRAM and PIE DIAGRAM come in the category of geometric diagrams. The bar diagram are 3 types. Simple, Multiple and Compo-nent bar diagrams.
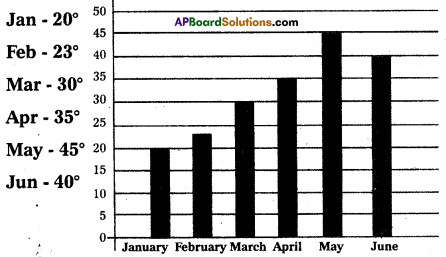
Simple Bar Diagrams: Bar diagrams are very commonly used and is better for representation of quantitative data. Bars are simply vertical lines, where the lengths of bars are proportional to their corresponding numerical values.
Ex : Maximum temperature recorded in Hyderabad in the 1st six months in a year in a bar diagram.
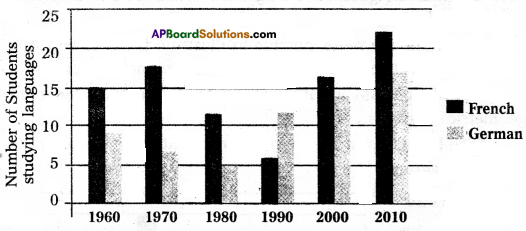
Multiple Bar Diagram:
Multiple bar diagrams are used for comparing two or more sets of data. Ex: The multiple bar diagram depicts the number of students in a college studying two foreign languages, French and German for the period 1960 – 2010 is given below.
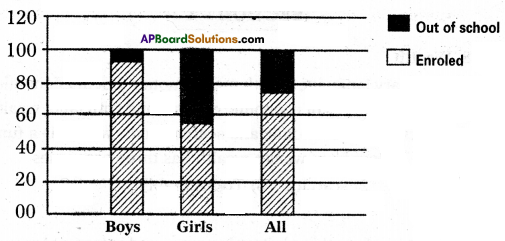
Component Bar Diagram:
Component bar diagram charts also called sub-divided bar diagram, are very useful in comparing the sizes of different component parts. Ex : Enrolment at primary level in a district of Bihar. Boys, girls and total children in the given age group are denoted in the component bar diagram is given below.
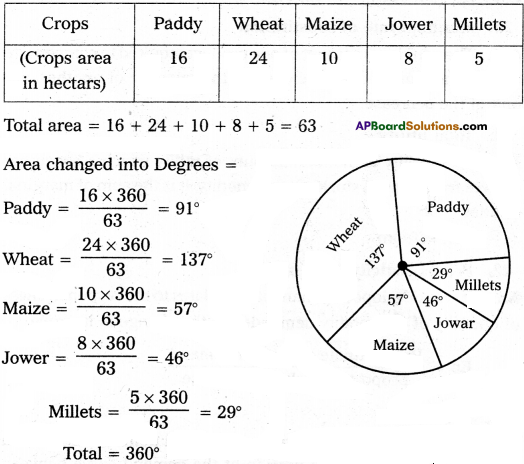
Pie – Diagram: This diagram enables us to show the partitioning of total into component parts. It is also called a pie chart. Ex : Draw the pie digram for following data.
Section – C
III. Answer any fifteen of the following questions in not exceeding 5 lines each. (15 × 2 = 30)
Question 18.
Intermediary goods
Answer:
Goods which are under the process of production and semi finished goods are known as inter mediary goods. Ex : cotton and fibre etc.
Question 19.
Wealth
Answer:
In ordinary language wealth means money or richness but in economics wealth means alll lands of economic goods along with land. Wealth in economics mean economic or scarce goods. All money is wealth but all wealth is not money. Wealth is a fund and income is flow from wealth. Wealth has the three properties.
1) Utility,
2) Scarcity,
3) Transferability.
![]()
Question 20.
Ordinal utility
Answer:
According to T.R. Hicks. Allen and other that utility can’t be measured in this way. We can observe the preference one for a good more than for another ordinal numbers such as 1st, 2nd, 3rd …. etc. The ordinal numbers are ranked.
Question 21.
Individual demand schedule
Answer:
Individual demand schedule explains the relationship between various quantities purchased at various prices by a single customer in the market.
Question 22.
Cross demand
Answer:
Cross demand refers to change in demand for a commodity or services as a result of a change in the prices of its related commodity or services. The study of cross demand is useful to classify the goods as substitutes and complementary goods. Cross demand is expressed as Dx = f(Py ) demand for X(Dx) is function of price of Y(Py).
Question 23.
Price elasticity of demand
Answer:
Alfred Marshall studied the concept of elasticity only with reference to price changes. It relates to the responsiveness of quality of commodity demanded to the change in its price it can be started as
Price elasticity of demand = \(\frac{proportionate change in demand}{proportionate change in price}\)
Question 24.
Arc method
Answer:
Arc method is the elasticity at the mid point of an Arc of a demand curve it studies a portion of the demand curve between two points. This is used when the changes in price is not very large.
Question 25.
Market period
Answer:
Market period is also known as very short period in this period the supply remains constant. This time period is not enough to change anyone of the factors of production. It may be one day or two days. Perishable goods like fish, vegetables flowers etc. will have only very short period market.
Question 26.
Average cost
Answer:
If we divided total cost by the number of units produced we will get average cost average cost means cost per unit of output.
Average cost = \(\frac{\text { total cost }}{\text { out put }} \)
Question 27.
Supply function
Answer:
It explain the functional relation between supply and the factors of production of a good.
Question 28.
Monopoly
Answer:
Mono means single poly means seller, in this market single seller and there is no close substitutes the monopolist is a price maker.
Question 29.
Duopoly .
Answer:
There are two sellers of a product. There exist duopoly. Each seller under duopoly must consider the other firms reactions to any changes that he may make in piece or output. They make decisions either independently or together.
![]()
Question 30.
Quasi – Rent
Answer:
The concept of Quasi rent was first introduced by Marshall. Quari rent according to marshall is the surplus earned by instruments of production other than land. It is the income earned from man made factors of production. Such as machinery, buildings, tools etc. This is short term concept.
Question 31.
Money – Rent
Answer:
Money wages are the renumination received by the labourer in the form of money for the physical and mental services sendered by him or her in the production process.
Ex: If a labourer is paid 30/- per day 30/- is the money wage.
Question 32.
Percapita income
Answer:
National income when divided by countries population.
Percapita income = \(\frac{National income }{total population }\)
The average standards of living of country is indicated by per capita income.
Question 33.
Grass National Product
Answer:
It is the total value of all final goods and services produced in the economy in one year.
GNP = C + I + G + (x – M) where
C = consumption
I = Gross national investment
G = Government expenditure
X = Exports M = imports
X – M = Net foreign trade
Question 34.
Time deposit
Answer:
The deposits are deposits that are not payable on demand. They are repayable only after their maturity period this deposits are also called term deposits they are two types :
1) fixed deposits
2) recurring deposits
Question 35.
Currency
Answer:
Currency consists of paper notes and coins paper notes are issued by the government or the central bank of a country. In india the reserve bank which is the central bank of india issue currency notes at all denominations except one rupee notes. The government of india issue them coins are metallic tokens and are produced in the mints of government.
![]()
Question 36.
Budget
Answer:
The statement total expenditure and total Revenue xeceipts are called Budget. There are three types of Budget.
1) Surplus Budget
2) Deficit Budget
3) Balanced Budget.
Question 37.
Median
Answer:
The median is a measure of central tendency, which appears in the centre of an ordered data. It is often described as the “middle most” or “most centra” value. It is called as position average.