The strategic use of AP Inter 1st Year Economics Model Papers Set 7 allows students to focus on weaker areas for improvement.
AP Inter 1st Year Economics Model Paper Set 7 with Solutions
Time: 3 Hours
Maximum Marks: 100
Section – A
I. Answer any Three of the following questions in not exceeding 40 lines each. (3 × 10 = 30)
Question 1.
Explain the Law of Diminishing marginal utility. What are its limitations?
Answer:
Hermann Heinrich Gossen was the first economist to explain the law of diminishing marginal utility in 1854. It is also known as Gossen’s ‘first law’. In 1890 Marshall in his principles of economics developed and popularised this analysis. This law explains the functional relationship between the stock of commodity the marginal utility of commodity.
According to Marshall “The additional benefit which a per-son derives from a given increase of his stock thing diminishes with every increase in stock that he already has”. “A consumer increases the consumption of any one commodity keeping constant the consumption of all other commodities the marginal utility of the variable commodity must eventually decline”. Kenneth E.Boulding. The law says that as we gone consuming a commodity satis-faction derives from its additional units goes on diminishes.
Assumptions :
- Rationality: Consumer is a rational man which means he always tries to get maximum satisfaction.
- Cardinal measurement of utility: Utility is a cardinal concept, i.e., utility can be measured and compared nu merically.
- Utilities are independent: It implies that utility of any commodity depends as its own quantity.
- Homogeneous: Units of the commodity are similar in quantity, size, taste and colour etc.
- No time gap: There should npt be any time gap between the consumption of one unit and other it.
- Constant marginal utility: It is assumed that the marginal utility of money remains constant.
- Total & marginal utility :
Total utility : Total satisfaction obtained by the consumer from the consumption of a given quantity of commodity.
TUn = f(Qn)
Where TUn = Total utility of n commodity,
f = functional relationship,
Qn = Quantity of n commodity.
Marginal utility : Marginal utility is the addition made to the total utility by consuming one more unit of the commodity.
It can be explained as
MUn = TUn – TUn-1
MUn = Marginal utility of nth unit
TUn = Total utility of nth unit
TUn-1 = Total utility of n -1 units.
MU may also be expressed as follows. Marginal utility is the additional utility derived from the con-sumption of an extra unit of commodity.
MU = \(\frac{\Delta \mathrm{TU}}{\Delta \mathrm{C}}\)
Where ∆TU = Change in total utility
∆C = Change in no. of units consumed.
Explanation of the law:
The law of diminishing marginal utility explains the relation between the quantity of good and its marginal utility. If a person goes on increasing his stock of a thing, the marginal utility derived from an additional unit declines. We show this tendency with an imaginary table given below.
| Unit of x apples | Total utility | Marginal utility |
| 1 | 40 | 40 – 0 = 40 |
| 2 | 70 | 70 – 40 = 30 |
| 3 | 90 | 90 – 70 = 20 |
| 4 | 100 | 100 – 90 = 10 |
| 5 | 100 | 100 – 100 = 0 |
| 6 | 90 | 90 – 100 = -10 |
In this table let us suppose that one is fond of apples. As he consumes one apple after another he derives less and less satisfaction. The first unit consumed with atmost pleasure. For the second, the intensity of his desire diminishes. The third will be still less and so on. The total utility increasing until the consumption of fourth unit of good but diminishing rate. Fifth unit of apple gives him maximum total utility. But marginal utility becomes zero. Further consumption of sixth unit TU diminishes and MU becomes negative.
The relationship between total utility and marginal utility is explained in the following three ways.
- When total utility increases at diminishing rate, marginal utility falls.
- When total utility is maximum, marginal utility becomes zero.
- When total utility decreases, marginal utility becomes negative. This can be shown in the following diagram.
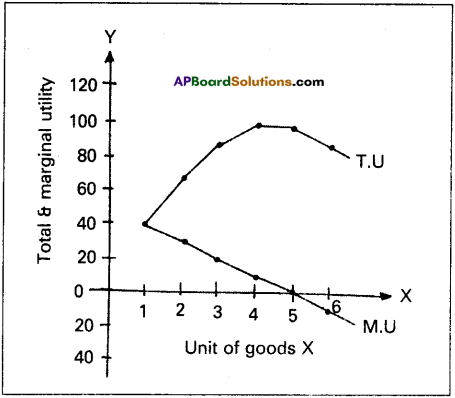
In the diagram on X’ axis measures units of apples and OY axis measures total utility and marginal utility. TU curve represents total utility and MU curve represents marginal utility. TU curve is maximum at 5th unit where MU curve will become zero. TU curve slopes downwards from 6th unit, while MU will become negative.
Limitations or Exceptions :
- Hobbies:
This law does not operate in the case of hobbies like collection of stamps, old paintings, coins etc. Greater the collections of a person, greater is his satisfaction. Marginal utility will not diminish. - Drunkers:
It is pointed out that the consumption of li¬quor is not subject to the law of diminishing marginal utility. The more a person drinks liquor, the more he likes it. - Miser:
This law does not apply to money. The more money a person has the greater is the desire to acquire still more of it. - Further:
this law does not hold good if any change in income of the consumer, tastes and preferences.
![]()
Question 2.
Discuss the different types of internal economies and external economies.
Answer:
Economies of large scale production can be grouped into two types.
1) Internal economies
2) External economies.
1. Internal Economies: Internal economies are those which arise from the expansion of the plant, size or from its own growth. These are enjoyed by that firm only. “Internal economies are those which are open to a single fac-tory or a single firm independently of the action of other firms”. Caimcross
i) Technological Economies:
The firm may be running many productive establishments. As the size of the productive establish-ments increase, some mechanical advantages may be obtained. Economies can be obtained from linking process to another process i.e. paper making and pulp making can be combined. It also used superior techniques and increased specialization.
ii) Managerial Economies:
Managerial economies arises from specialisation of management and mechanisation of mana¬gerial functions. For a large size firm it becomes possible for the management to divide itself into specialised departments under specialised personnel. This increases efficiency of management at all levels. Large firms have the opportunity to use advanced techniques of communication, computers etc. All these things help in saving of time and improve the efficiency of the management.
iii) Marketing Economies:
The large firm can buy raw materials cheaply, because it buys in bulk. It can secure special concession rates from transport agencies. The product can be advertise better. It will be able to sell better.
iv) Financial Economies:
A large firm can arise funds more easily and cheaply than a small one. It can borrow from bankers upon better security.
v) Risk bearing Economies:
A’large firm incurs unrisk and it can also reduce risks. It can spread risks in different ways. It can undertake diversifications of output. It can buy raw materials from several firms.
vi) Labour Economies:
A big firm employs a large number of workers. Each worker is given the kind of job he is fit for.
2. External Economies: An external economy is one which is available to all the firms in an industry. External economies are available as an industry grows in size.
i) Economies of Concentration:
When a number of firms producing an identical product are localised in one place, certain facilities become available to all. Ex: Cheap transport facility, avail-ability of skilled labour etc.
ii) Economies of Information:
When the number of firms in an industry increases collective action and co-operative effort becomes possible. Research work can be carried on jointly. Scientific journal can be published. There is possibility for exchange of ideas.
iii) Economies of Disintegration:
When the number of firms increases, the firm may agree to specialise. They may divide among themselves the type of products of stages of production. Ex: Cotton industry.
Question 3.
Define perfect competition. How price of commodity is determined under perfect competition.
Answer:
Perfect competition is a competition in which the number of buyers and sellers is very large. All enged in buying and selling a homogeneous without any restrictions. Under this competition there are large no. of by buyers and sellers no buyer is a seller can’t influence market price all products are homogeneous there is a freedom of free entry and exit. There is a perfect mobility of factors are production. There is no trans¬port cost these are the main features are perfect competition.
Price determination :
Under perfect competition sellers and buyers can’t decide the price industry decides the price of the good in the supply and demand determined the price these can shown in the following table.
| Price | Quantity supplied | Quantity demanded |
| 1 | 20 | 60 |
| 2 | 30 | 50 |
| 3 | 40 | 40 |
| 4 | 50 | 30 |
| 5 | 60 | 20 |
In this competition where demand supply both are equal at that point price and output determine the table changes in price always lead to a change in supply and demand as price increases there is a fall in the quantity demanded. The relation between price and demand is negative. The relation between price and supply is positive. It can be observe the table price ₹ 1 market demand 60 and supply is 20. When price increases ₹ 5 supply increases 60 and demand decreases 20. When the price is ₹ 3 the demand supply are equal that is 40 these price called equilibrium price. This process is explain with help of the diagram.
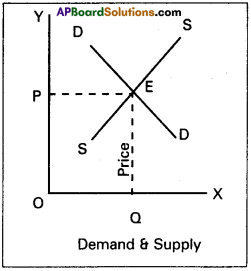
In the diagram ‘OX’ axis shown demand and supply ‘OY axis represented price. DD de¬mand curve, ‘SS’ is supply curve. In the diagram the demand curve and supply r i ve intersect at point E. Where the price is ‘OP’ and output is ‘OQ’.
Question 4.
Explain the various methods of calculating National Income.
Answer:
There are three methods of measuring National Income.
- Output method or Product method
- Expenditure method
- Income method
‘Carin cross’ says National Income can be looked in any one of the three ways. As the national income measured by adding up everybody’s income by adding up everybody’s output and by add-ing up the value of all things that people buy and adding in then- savings.
1) Output method (Product method):
The market value of total goods and services produced in an economy in a year is con-sidered for estimating National Income. In order to arrive at the value of the product services, the total goods and services pro-duced are multiplied with their market prices.
Then National Income = (P1Q1 + P2Q2 + •••• PnQn) –
Depreciation— Indirect taxes + Net income from abroad.
Where P = Price
Q = Quantity
1,2,3 …… n = Commodities & services
There is a possibility of double counting. Care must be taken to avoid this. Only final goods and services are taken to compute National Income but not the raw materials or intermediary goods. Estimation of the National Income through this method will indicate the contribution of different sectors, the growth trends in each sector and the sectors which are lagging behind.
2) Expenditure method:
In this metlv we add the per¬sonal consumption expenditure of households, expenditure of the firms, government purchase of goods and services net exports plus net income from abroad.
NI = EH + EF + EG + Net expprts + Net income from abroad.
Here National Income = Private final consumption expenditure + Government final consumption expenditure + Net domestic capital formation + Net exports + Net income from abroad
EH = Expenditure of households
EF = Expenditure of firms
EG = Expenditure of Government
Care should be taken to include spending or expenditure made on final goods and services only.
3) Income method: In this method, the incomes earned by all factors of production are aggregated to arrive at the National Income of a country. The four factors of production receive in-comes in the form of wages, rent, interest and profits. This is also national income at factor cost.
NI = W + I + R + P + Net income from abroad
NI = National
W = Wages
I = Interest
R = Rent
P = Profits
This method gives us National Income according to distribute shares.
![]()
Question 5.
Explain the concept of under-employment equilibrium with the help of a diagram.
Answer:
Under employment equilibrium is a situation when all resources are not fully used and same resources are lying idle or under utilised. In case of under employment, equilibrium increase in aggregate demand brought about by expansionary fiscal and monetary policies will lead to increase in aggregate supply.
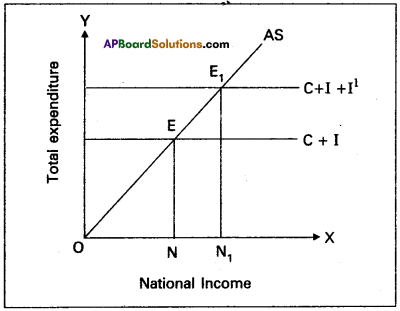
Keynesian employment theory states that in general there is unemployment in the economy in the short run that is caused by deficiency of aggregate demand. This can be shown in the side dia-gram. Output is shown on X-axis as national income on the Y-axis consumption expenditure (Q and investment I are measured. AS is the aggregate supply curve. E represents the equilibrium point. ON output represents low level employment and to ensure full employment. The output should reach ON1 level.
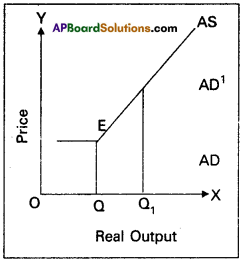
The aggregate demand helps determine output in the Keynesian approach. AS is upward sloping curve. AD and AS intersects at point A. It implies that a modem market economy can get trapped in an un-der employment equilibrium. Thus Keynes’s analysis created a revolu-tion in macro economics.
In the above diagram aggregate demand price curve (AD) and the aggregate supply price curve (AS) interest each other at point Er It shows the equilibrium point. The equilibrium has been attained at ONt level of employment. It is assumed that ONj in the above diagram does not indicate full employment as the economy is having idle factors of production. So it is considered as underemployment equilibrium.
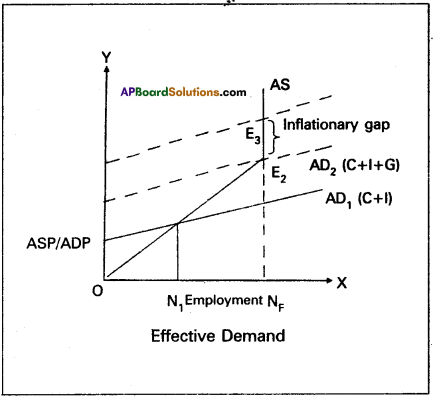
According to Keynes, to achieve full employment an upward shift of aggregate demand curve is required. This can be possible through government expenditure on goods and services supplied in the economy, whenever private entrepreneurs may not show interest to invest. With this the AD1 curve (C + I) shift as AD2 (C + I + G) at new point of effective demand E2, where the economy reaches full employment level i.e., ONF.
Section – B
II. Answer any Eight of the following questions in not exceeding 20 lines each. (8 × 5 = 40)
Question 6.
What are the methods of Economic Investigation?
Answer:
According to Peterson “The term method refers to the techniques and producers used by economists for both construction and verification economic principles. There are mainly two methods used by the economists for conducting economic investigations. They are:
1) Deductive method
2) Inductive method.
1. Deductive method:
This method is also known as the analytical and abstract method. The method of studying phenom-enon by taking same assumptions and deducing conclusions from those assumptions is known as the deductive method. It proceeds from general to the particular or from universal to the individual. This was advocated by economists belonging to the classical school. There are four steps involved in drawing inference through deductive method. They are :
- Selecting the problem
- Formulating assumptions
- Formulating hypothesis
- Verifying the hypothesis.
The law of diminishing marginal utility is one law derived using this deductive method.
Merits of deduction:
- It is less expensive and less time consuming.
- It analyses complex economic phenomena and bring exactness to economic generalizations.
- It helps in laying down basic principles of human behaviour.
Inspite of the above stated advantages, it is not free from limitations. It is based on unrealistic assumptions with little em-pirical content.
2. Inductive method:
This method is also known as Histori-cal, Empirical, Concrete, Ethical or Realistic. This method was strongly advocated and made use of by economists belonging to the historical school. This method proceeds from a part to the whole from particular to general or from the individual to the universal. The following are the important steps involved in deriving economic generalisations through inductive method.
- Selection of the problem
- Collection of data
- Observation
- Generalisation
Merits of induction method :
1) It is nearer to reality and therefore expected to depict reality.
2) This method involves less chances of mistakes.
Inspite of several advantages it has its own defects. This method is expensive and time consuming. It can be used by those who possess skill and competance in handling complex data.
Question 7.
Explain the factors that determine demand.
Answer:
Factors of demand:
1) Price of commodity: The demand for any good depends on its price, more will be demanded at lower price and vice-versa.
2) Prices of substitutes and complementaries : Demand is influenced by changes in price of related goods either substitutes or complementary goods. Ex : Increase in the price of coffee leads an increase in the demand for tea in the case of substitutes positive relation and complementaries negative relationship between price and demand.
3) Income of the consumer: Demand always changes with a change in the incomes of the people. When income in-creases the demand for several commodities increases and vice-versa.
4) Population: A change in the ‘size and composition of population will effect the demand for certain goods like food grains, clothes etc.
5) Taste and preferences: A change in the taste and the fashions bring about a change in the demand for a com-modity.
6) Technological changes: Due to economic progress tech-nological changes the quantity the quality of goods avail-able to the consumers increase. Ex : Demand for cell phones reduced the demand for landline phones.
7) Change in the weather: Demand for commodity may change due to change in a climatic condition. Ex : During summer demand for cool drinks, in winter demand for wollen clothes.
8) State of business: During the period of prosperity de-mand for commodities will expand and during depres-sion demand will contract.
![]()
Question 8.
Why a demand curve has a negative slope?
Answer:
According to Marshall “The amount demanded increases with a fall in price and diminishes with a rise in price when other things remain the same”. The law of demand explains inverse relationship between the price and quantity demanded of a commodity. Therefore the demand curve slopes downward from left to right. There are some other reasons also responsible for downward sloping demand curve.
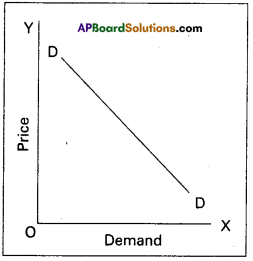
- Old and new buyers:
If the price of a good falls, the real income of the old buyers will increase. Hence the demand for the good will increase. In the same way, the fall in price attracts new buyers and will be able to built after a fall in its price. So the demand curve slopes downards from left to right. - Income effect:
Fall in price of commodity the real income of its consumers increase. The increase in real income encourages demand for the commodity with reduced price. The increase in de-mand on account of increased in real income is known as income effect. - Substitution effect:
When the price of commodity falls, it will become relatively cheaper than its substitutes. The increase in demand on account of increased in real income is known as income effect. - Law of diminishing marginal utility:
According to this law, if consumer goes on consuming more units of the commodity, the additional utility goes on diminishing. Therefore, the consumer prefers to buy at a lower price. As a result the demand curve has a negative slope.
Question 9.
Write properties of indifference curve.
Answer:
Indifference curve represents the satisfaction of a consumer from two goods of various combinations. Properties of ICS:
- Indifference curves slopes downwords from left to right there exist negative slope.
- Indifference curves are convex to origin because of di minishing marginal rate of substitution.
- Indifference curves can never intersect each other.
- Higher indifference curve represent higher level of satisfaction indifference curve to the right represents higher satisfaction.
Question 10.
What is meant by price discrimination? What are the methods of price discrimination ?
Answer:
Price discrimination refers to the practice of a monopolist charging different prices for different customers of the same product. In the words of Joan Robinson “The act of selling the same article, produced under single control at different prices to differ-ent buyers is known as price discrimination”.
Price discrimination is of three types.
- Personal
- Local
- Use or trade discrimination.
1) Personal discrimination:
When a seller charges different prices from different persons. Ex: A book is sold ₹ 15/- to one person and other person at discount rate of ₹ 12/-
2) Local discrimination :
When a seller charges different prices from people of different localities or places. Ex: Dumping.
3) Use discrimination:
When different prices of commodity are charged according to the uses to which the commodity is put is known discrimination is according to use. Ex: Electricity is sold at a cheaper rate for uses of domestic purposes than for industrial purposes.
Question 11.
What are the factors that determine national income?
Answer:
National Income is the total market value of all goods and services produced in a country during a given period of time. There are many factors that influence and determine the size of national income country.
a) Natural resources: The availability of natural resources in a country, its climatic conditions, geographical features, fertility of soil, mines and fuel resources etc., influence the size of National Income.
b) Quality and Quantity o£ factors of production : The national income of a country is largely influenced by the quality and quantity of a country’s stock of factors of production.
c) State of technology : Output and national income are in-fluenced by the level of technical progress achieved by the country. Advanced techniques of production help in optimum utiliza¬tion of a country’s national resources.
d) Political will and stability: Political will and stability in a country helps in planned economic development and for a faster growth of National Income.
![]()
Question 12.
What are the sources of public revenue?
Answer:
Revenue received by the government from different sources is called public revenue. Public revenue is classified into two kinds.
1) Tax revenue
2) Non-Tax revenue.
1) Tax Revenue: Revenue received through collection of taxes from the public is called tax revenue. Both the state and central government collect taxes as per their allocation in the constitution.
Taxes are two types.
a) Direct taxes:
i) Taxes on income and expenditure. Ex : Income tax, Corporate tax etc.
ii) Taxes on property and capital assests. Ex : Wealth tax, Gift tax etc.
b) Indirect taxes : Taxes levied on goods and services.
Ex : Excise duty, Service tax.
2) Non – tax revenue: Government receives revenue from sources other than taxes and such revenue is called non-tax revenue. They are
a) Administrative revenue: Government receives money for certain administrative services. Ex : License fee, Tution fee -etc.
b) Commercial revenue:
Modem governments establish public sector units to manufacture certain goods and offer certain services. The goods and services are exchanged for the price. So such units earn revenue by way of selling their products. Ex : Indian Oil Corporation, Bharath Sanchar Nigam Ltd, Bharath Heavy Electricals, Indian Railways, State Road Transport Corporations, Indian Air lines etc.
Question 13.
What are the main features of monopolistic competition?
Answer:
It is a market with many sellers for a product but the products are different in certain respects. It is mid way of monopoly and perfect competition. Prof. E.H. Chamberlin and Mrs. Joan Robinson pioneered this market analysis.
Features or Characteristics of Monopolistic competition :
- Relatively small number of firms: The number of firms in this market are less than that of perfect competition. No one should not control the output in the market as a result of high competition.
- Product differentiation: One of the features of monopolistic competition is product differentiation. It take the form of brand names, trade marks etc. It cross elasticity of demand is very high.
- Entry and exit: Entry into the industry is unrestricted. New firms are able to commence production of very close substi-tutes for the existing brands of the product.
- Selling cost: Advertisement or sales promotion technique is the important feature of Monopolistic competition. Such costs are called selling costs.
- More Elastic Demand: Under this competition the demand curve slopes downwards from left to the right. It is highly elastic.
Question 14.
What are the factors that determine real wages?
Answer:
The amount of goods and services that can be purchased with the money wages at any particular time is called real wage. Thus real wage is the amount of purchasing power received by worker through his money wage.
Factors determining the real wage :
1. Methods of form of payment:
Besides money wages, normally the labourers get same additional facilities provided by their management. Ex : Free housing, free medical facilities etc. As a result this real wage of the worker will be high.
2. Purchasing power of money:
An important factor which determines the real wage is the purchasing power of money which depends upon the general price level. A rise in general price level will mean a full in the purchasing power of money, causes decline in real wages.
3. Nature of work:
The working conditions also determine the real wages of labourer. Less duration of work, ventilation fresh air etc., result in high real wages, lack of then facilities real wages are low eventhough money wages are high.
4. Future prospects:
Real wage is said to be higher in those jobs where there is possibility of promotions hike in wages and vice-versa.
5. Nature of work:
Real wages are also determined by the risk and danger involved in the work. If work is risky
wages of labourer will be low though money wages are high. Ex : Captain in a submarine.
6. Timely payment:
If a labourer receives payment regularly and timely the real wages of the labourer is high although his money wage is pretty less and vice-versa.
7. Social prestige: Real wage depends on social prestige. The money wages of Bank officer and judge are equal, but the real wage of a judge is higher than bank officer.
8. Period and expenses of education: Period and expenses of training also affect real wages.
Question 15.
Describe the measures to control inflation.
Answer:
To control the inflation the government has taken various steps. They are :
- Increase the production in the long term.
- Implementing proper monetary and fiscal policies to reduce the supply of money and credit.
- Controlling prices and eliminating black market.
- Importing the goods which are scarer in supply from outside countries.
- Introducing rational and quota system in case of mass communication of consumption of goods.
- Distribution of goods to all the needy sections of the people.
Question 16.
Explain the functions of money any five.
Answer:
Money plays a vital role in modern economy. A modern economy is rightly known as monetary economy because of the crucial position that money occupies.
- According to ‘Robertson’ Anything which is widely accepted in payment for goods or it discharges of other kinds of business obligations”.
- According to ‘Seligman’ – “One that possesses general acceptability”.
- According to Waker’ – “Money is what money does”.
Functions of money:
1. Primary functions :
a) Medium of exchange: Money serves as a medium of ex-change. It removes the inconveniences of the barter system in which exchange of goods was possible -if only there was double coinci-dence of wants. But money facilitates exchange of commodities without double coincidence wants. Any commodity can be ex-change for money. People can exchange goods and services through the medium of money.
b) Measure of value:
Money serves as a measure of the value of goods and services. As common measure of value it has removed the difficulty of the barter system and has made transac-tions simple and easy. The value of each commodity is expressed in the units of money. We call if the price.
2. Secondary functions:
a) Store of value :
The value of commodities and services can be stored in the form of more. Certain commodities are perish-able. If they are exchanged for money before they perish, their value be preserved in the form of money.
b) Standard of deferred payments:
Money serves as a stan-dard of deferred payments. The modem economies most of the business transactions take place on the basis of credit. An indi-vidual consumer or a business man may now purchase a commod-ity and pay for it in future as this function makes it possible to express future payments in terms of money.
c) Transfer of money:
Money can be transferred from one person to another at any time at any place.
3. Contingent functions:
a) Measurement and distribution of National income:
Na-tional income of a country be measured in money by aggregating the value of all commodities. This is not possible in a barter system similarly national income can be distributed to different factors of production by making payment them in money.
b) Money equalises marginal utilises/productivities:
The consumers can equalize marginal utilities of different commodities purchased by them with the help of money. We know how consumers equalize the marginal utility of the taste rupee they speed on each commodity. Similarly firms can also equalize the marginal ‘ productivities of different factors of production and maximize profits.
c) Basis of credit:
Credit is created by banks from out of the primary deposits of money supply of credit, in an economy is dependent on the supply of nominal money.
d) Liquidity:
Money is the most important liquid asset. Interms of liquidity, it is superior other assets. Money is centpercent liquid.
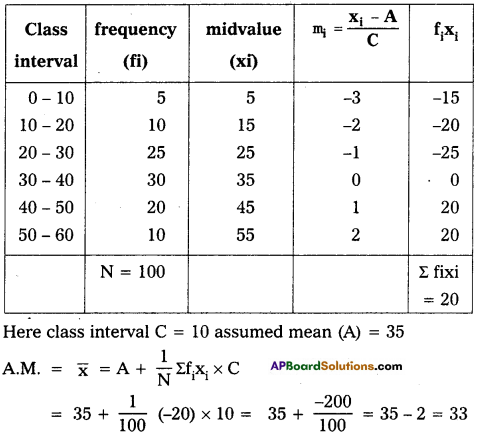
Question 17.
Find the mean the following frequency distribution by step deviation method.
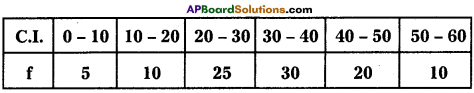
Answer:
Section – C
III. Answer any fifteen of the following questions in not exceeding 5 lines each. (15 × 2 = 30)
Question 18.
Problem of choice
Answer:
According to Robbin’s choice making is really on economic activity. Every man is faced with the scarcity of means and as such is forced to make a choice in his present and future satisfaction of wants and in his allocation of resources. The choice problem is the central problem of economics. The problems of the economy, “what to produce ?” and “how to produce ?” are the problem of choice between commodities and the problem of choice of production techniques respectively.
![]()
Question 19.
Micro Economics
Answer:
The terms micro-economics and macro-economics were first coined and used by ‘Ragnar Frisch’ in the year 1933. The word ‘Micro’ is a greek word, it means very small, it was developed by Alfred Marshall. Micro-economics is also called as price theory, because it explains pricing in factor market and in product market. It studies about the individual units of the economy like individual income, individual saving, individual investment etc.
Question 20.
Price
Answer:
The value of a commodity expressed in terms of money is known as price. The price of anything is its value -measured in terms of a standard money value. Ex : A pen is exchanged for 10 rupees then the price of that pen is 10 rupees.
Question 21.
Cardinal utility
Answer:
Alfred Marshall developed cardinal utility analysis. According to this analysis the utilities derived from of arbitrary units called utils cardinal numbers’ and also can compare the utilities of different commodities.
Question 22.
Price line / Budget line
Answer:
The budget line shows all possible combinations of two goods that a consumer can buy with the given income of the consumer and prices of the two goods budget line is also known as price line.
Question 23.
Indifference map
Answer:
A set of indifference curves drawn for different income levels is called indifference map.
Question 24.
Land
Answer:
In common usage land means surface of the earth. In economics land refers all natural resources like forests, water, climate, minerals etc. Features of land :
- Gift of nature
- Limited in supply
- Immobile factor
- Diminishing returns
- Land differs infertility
![]()
Question 25.
Average product
Answer:
Average production refers to the product per unit of labour. If total product is divided by the number of labourers employed we get average product.
Average product = \(\frac{\text { Total product }}{\text { Number of labour }}\)
Question 26.
Supply function
Answer:
The relation between the supply and the factors that decide the supply is explained in the form of an equation known as supply function.
Where Sx = f[Px, P1 T, W, Gp]
Sx = Supply of good
f = Functional relationship
Px = Price of ‘x’ commodity
P1 = Price of inputs
T = Technology
W = Weather conditions
Gp = Government Policies
Question 27.
Opportunity cost
Answer:
The concept of Opportunity cost was first, introduced by Vleser an Austrian economist. Later it was developed by Knight, Davenport, Wicksteod and Robins&n. According to Austrian School of economist opportunity cost is the next best alternative sacrificed in order to obtain that commodity.
Question 28.
Marginal revenue
Answer:
Marginal revenue is the additional revenue earned by selling one more unit of the product
Marginal revenue = \(\frac{\text { Change the total Re venue }}{\text { Change quantity }}=\frac{\Delta T R}{\Delta Q}\)
Question 29.
Price discrimination
Answer:
A monopolist can change different for prices for the same product for different buyers provided these buyers from different makets or belong to non-competing groups. This is known as discrimination monopoly or price discrimination.
Question 30.
Quasi Rent
Answer:
The Quasi-rent concept used by Marshall, refers to the short, run earning man made factors. They are fixed in supply in the short-run when demand for them increases, their price. Therefore the earnings of man made factors like machines and tools in short- run depend mainly upon the demand conditions.
Question 31.
Net – interest
Answer:
The term net interest refers to the payment for the use of capital alone. This is also referred to the as pure or net or economic interest.
Question 32.
Deficit Budget
Answer:
Deficit budget arises when the total expenditure in the budget exceeds the total receipts in the budget.
![]()
Question 33.
Liquidity
Answer:
Liquidity means the ease with which one can convert a financial asset into a medium of exchange. Liquidity is greatest for money as an asset because money itself is a medium of exchange. Infact money is the only asset which possess perfect liquidity.
Question 34.
Overdraft
Answer:
This is a facility allowed by the bank to the current account holder. Sometimes they are allowed to draw and amount above the balance in their account. They can over draw the amount upto a certain limit fixed by the banks.
Question 35.
Recurring Deposit
Answer:
People will deposit their money in these deposits as monthly instalments for fixed period of time. A fixed amount in the multiples of ₹ 10 may be deposited every month for a period one or more years.
Question 36.
Cost push inflation
Answer:
Inflation cassed by the rise in cost of production is called cost push inflation. Cost of production may rise due to the increase in wages forced by the trade unions or government.
Question 37.
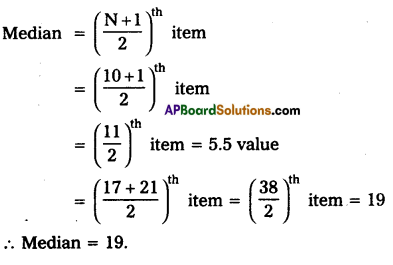
Find the median of following data 30, 5, 21, 42, 13,10, 27, 33, 17, 8
Answer:
Arranging accesending order. 5, 8, 10, 13, 17, 21, 27, 30 33, 42