The strategic use of AP Inter 1st Year Economics Model Papers Set 5 allows students to focus on weaker areas for improvement.
AP Inter 1st Year Economics Model Paper Set 5 with Solutions
Time: 3 Hours
Maximum Marks: 100
Section – A
I. Answer any Three of the following questions in not exceeding 40 lines each. (3 × 10 = 30)
Question 1.
Distinguish between Micro Economics and Macro Econo-mics. How are they interdependent.
Answer:
Modern economic theory divided it into two branches,
namely
(i) Micro Economics
(ii) Micro Economic
Ragnar Frisch was the first economist to use the words “Micro and Macro” in economic theory in 1930.
Micro Economics:
The term “Micro Economics” is derived from the Greek word ‘MIKROS’ which means small. Thus micro economics is the theory of small. It was developed by classical economists like Adam Smith, J.B.Say, J.S.Mill, Ricardo, Marshall etc. It studies about individual units or behaviour of that particular units like individual income, price, demand etc. Micro Economics is also known as partial analysis. If main, concentrates on the determination of prices of commodities and factors of production. It is also known as “Price theory”. According to K.E. Boulding Micro Economics is the study of particular firms, particular house-holds, individual prices, wages, incomes individual industries and particular commodities. Shapiro says “Micro Economics has got relation with small segments of the society.
Macro Economics:
The term Macro Economics is derived from the Greek word ‘MAKROS’ which means large. Thus Macro Economics is the study of economic system as a whole. It was developed by J.M. Keynes. It studies aggregates in the economy like national income, total consumption, total saving and total em-ployment etc. It is also known as Income and Employment theory.
According to Boulding “Maero Economics studies National Income not Individual income, general price level instead of indi-vidual prices and national output instead of individual output. Macro Economics also studies the economic problems like pov-erty, unemployment, economic growth, development etc. It is also deals with the theory of distribution.
The difference between Micro Economics and Macro Eco-nomics:
Micro and Macro Economics are interrelated to each other. Inspite of close relationship between the two branches of economics, fundamentally they differ from each other.
| Micro Economics | Macro Economics |
| 1. The word micro derived from the greek word ‘ Mikros’ means “small”. | 1. The word macro derived from the greek word ‘Makros’ which means “large”. |
| 2. Micro Economics is the study of individual units of the economy. | 2. Macro Economics is the study of economy as a whole. |
| 3. It is known as Price theory. | 3. it is known as Income and Employment theory. |
| 4. Micro Economics explains price determination both commodity and factor markets. | 4. Macro Economics deals with national income, total employment, general price level and economic growth. |
| 5. Micro Economics is based on price mechanism which depends on demand and supply | 5. Macro Economics based on aggregate demand and aggregate supply. |
Question 2.
Explain the law of demand and its exceptions.
Answer:
Demand means a desire which is backed up by ability to buy 1 and willingness to pay the price is called Demand. Thus demand will be always to a price and time demand has the following features.
- Desire for the commodity
- Ability to buy the commodity
- Willing to pay the price of commodity
- Demand is always at a price
- Demand is per unit of time i.e, per day, week etc. Therefore the price demand may be expressed in the form of small equation.
Dx = f(Px)
Price demand explains the relation between price and quantity demanded of a commodity. Price demand states that there is an inverse relationship between price and demand.
Law of demand:
Marshall defines the law of demand as, “The amount demanded increases with a fall in price and diminishes with arise in price when other things remain the same”. So, the law of demand explains the inverse relationship between the price and quantity demanded of a commodity.
Demand schedule:
It means a list of the quantities demanded at various prices in a given period of time in a market. An imaginary example given below.
| Price in ₹ | Quantify Demanded units |
| 5 | 10 |
| 4 | 20 |
| 3 | 30 |
| 2 | 40 |
| 1 | 50 |
The table shows that as ‘ the price falls to ₹1/- the quantity demanded 50 units, when price ₹5/- he is buying 10 units. So, there is inverse relationship between price and demand. Price is low demand will be high and price is high demand will be low. We can illustrate the above schedule in a diagram.
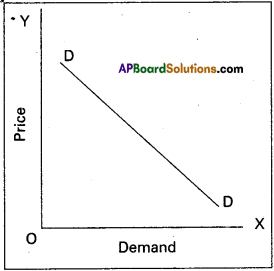
In the above diagram on X-axis demand is shown and price is on Y-axis. DD is the demand curve. Demand curves slopes downward from left to right.
Assumptions :
- No change in the income of consumer
- The taste and preferences consumers remain same.
- The prices of related goods remain the same.
- New substitutes are not discovered.
- No expectation of future price changes.
Exceptions:
In certain situations, more will be demanded at higher price and less will be demanded at a lower price. In such cases the demand curve slopes upward from left to right which is called an exceptional demand curve. This can be shown in the following diagram
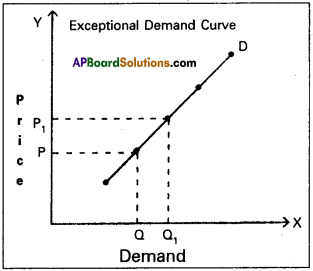
In the diagram when price increases from OP to OP1( de-mand also increases from OQ to OQ1. This is opposite to law of demand.
1) Giffen’s Paradox :
This was stated by Sir Robert Giffen. He observed that poor people will demand more of inferior goods, if their prices , aise. Inferior goods are known as Giffen goods.
Ex : Ragee, Jowar etc. He pointed out that in case of the English workers, the law of demand does not apply to bread. Giffen noticed that workers spend a major portion of their income on bread and only small portion on meat.
2) Veblen Effect (Prestigious goods):
This exception was stated by Veblen. Costly goods like diamonds and precious stones are called prestige goods or veblen goods. Generally rich people purchase those goods for the sake of prestige. Hence rich people may buy more such goods when their prices rise.
3) Speculation:
When the price of a commodity rises the group of speculators expect that it will rise still further. Therefore, they buy more of that commodity. If they expect that there is a fall in price, the demand may not expand. Ex : Shares in the stock market.
4) Illusion:
Some times, consumer develop to false idea that a high priced good will have a better quality instead of low priced good. If the price of such good falls, demand decreases, which is contrary to the law of demand.
![]()
Question 3.
Explain the short run and long run equilibrium of a firm under perfect competition with suitable diagram.
Answer:
Perfect competition is a form of a market in which there is a large number of buyers and sellers. They sell homogeneous goods. Each firm produces only a small portion of the total out put produced by the whole industry.
Equilibrium of the firm in the short run:
A firm is said to be in equilibrium when it has no incentive either to expand or to contract its output. Short period is a period is a period in which the supply of goods can be adjusted to the change in the demand only to some extent. A firm is at equilibrium when it is earning maximum profits. There are two conditions for attaining equilibrium by firm. They are :
1) Marginal Cost (MC) must be equal to Marginal Revenue (MR).
2) Marginal Cost curve must cut the marginal revenue curve from below.
Marginal cost is the additional cost incurred by a firm producing an additional unit of output. Marginal revenue is the additional revenue accurred by a firm producing an additional unit of output Marginal revenue is the additional revenue accured to a firm when it sells one more unit of output. A firm increases its output so long as its marginal cost is less than marginal revenue it is only at the point where marginal cost is equal to marginal revenue the firm attains equilibrium. Firm equilibrium can be shown with the help of diagram.
Equilibrium of a firm: In the diagram, X-axis represents output and ‘Y-axis represents revenue cost and price. ‘PD’ is the average and marginal revenue curve. MC is the marginal cost curve. The U’ shaped marginal cost curve interesects the marginal revenue curve at points ‘R’ and Q. Point
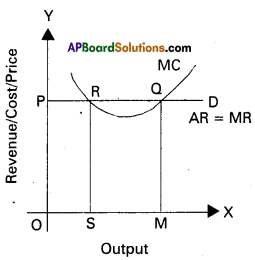
R’ is not the equilibrium point because at this point ‘MC’ curve intersects the ‘MR’ curve from about side. Point ‘Q’ is said to the equilibrium point because at this point the marginal cost is not only equal to marginal revenue but also the ‘MC’ curve interesects the ‘MR’ curve from below side. At this equilibrium point, equilibrium point equilibrium output is ‘OM’.
Equilibrium of an industry:
An industry is the combination of firms producing the same commodity. An industry is said to be in equilibrium when there is no incentive for new firms enter the industry and for existing firms to leave the industry. An industry is in equilibrium when its market demand is equal to market supply. Moreover all the firms in the industry are supposed to be in equilibrium.
When an industry is in equilibrium, all firms earn only normal profits. Because under perfect competition conditions all firms are assumed to be the same level of efficiency in the longrun. There is no incentive for new firms to enter the industry and for existing firms to leave the industry. Therefore these conditions are satisfied by the industry.
1) MC = MR
2) AR = AC (at minimum point). These conditions can be understood with the help of the following diagrams.
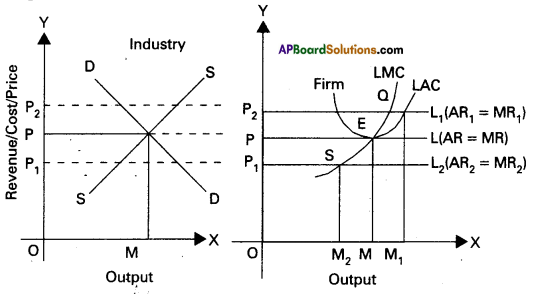
In the diagrams illustrate equilibrium of the firm and industry. LAC is the longrun average cost curve and LMC is the longrun marginal cost curve. PL, P, Lj, and P^ are price lines. Equilibrium price OP is determined by the intersection of market demand and market supply price ‘OM’ is the equilibrium output. The firm under perfect competition accepts this ‘OP’ price. At price ‘OP’, firms ‘MC’ curves cuts ‘MR’ at E’ point. The firm is therefore in equilibrium at E’ and produces ‘OM’ output. At OM’ output level AR = AC of the firm. Hence the form earns normal profits.
Question 4.
Explain the concept of under employment equilibrium with the help of a diagram.
Answer:
Under employment equili¬brium is a situation when all Y resources are not fully used and same resources are lying idle or under utilised. In case of under employment, equilibrium incre¬ase in aggregate demand brought about by expansionary fiscal and monetary policies will lead to increase in aggregate supply.
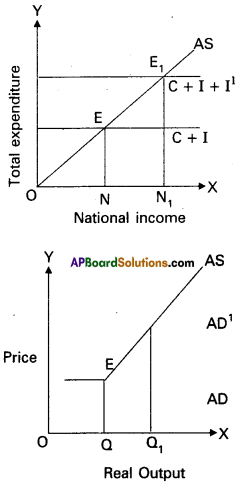
Keynesian employment theory states that in general there is unemployment in the economy in the short run that is caused by deficiency of aggregate demand. This can be shown in the side dia-gram. Output is shown on X-axis as national income on the Y-axis consumption expenditure (Q and investment I are measured. AS is the aggregate supply curve. E rep-resents the equilibrium point. ON output represents low level em-ployment and to ensure full employment.
The output should reach ONj level. The aggregate demand helps determine output in the Keynesian approach. AS is upward sloping curve. AD and AS intersects at point A. It implies that a modem market economy can get trapped in an under employment equilibrium. Thus Keynes’s analysis created a revolution in macro economics.
Question 5.
Describe the functions of the commercial banks.
Answer:
Functions of commercial banks:
Primary functions :
a) Accepting deposits: The commercial bank just like any other money lender is doing money lending business bank receives public money in the form of deposits. The deposits mainly are of the following steps.
1) Current deposits:
These deposits have two character-istics. One, there are no restrictions with regard to the amount of withdrawl and number of withdrawls. Banks normally do not pay any interest on current account deposits.
2) Savings deposits:
The sole aim of banks in receiving these deposits is to promote the habit of thrift among low income groups. They have the following characteristics : 1) two or three withdrawls per week are permited 2) banks pay 4 to 5% interest (nominal) per annum or savings deposits.
3) Recurring deposits:
People will deposit their money in these deposits as monthly installments for a fixed period of time. The bank after expiry of the said period will return the total amount with interest thereon. The rate of interest will be higher than the savings deposits:
4) Fixed deposits:
Deposits received on fixed accounts are called fixed or time deposits. They are left with the bank for a fixed period. The following are the characteristics.
i) The amount cannot be withdrawn before the expiry of the fixed period.
ii) Banks pay high rate of interest than any other deposits.
b) Advancing loans: Commercial banks release funds so collected for productive purposes by way of loans and advances. Commercial bank usually lend money by way of loans, cash cred-its, overdrafts and by discounting bills of exchange.
1) Cash credit:
In this case, the borrower is given a loan. The amount of the loan is deposited in his account in the bank. The loan is not normally paid in cash. The borrower can draw money out of this account as per his needs.’
2) Overdraft:
It means allowing the depositor to overdraw his account upto a previous agreed limit. Banks allow overdrafts only to those persons who have their accounts in the bank. The over¬draft is granted only for short period for customers, –
3) Loans:
Usually a loan is granted against the securities of assets or the personal security of the borrower bank loans and advances carry a high rate of interest. In addition, banks grant call loans for every short period, term loans for longer period and also grant consumer credit for buying durable goods.
4) Discounting bills of exchange:
The banks facilitate trade and commerce by discounting the bills of exchange. This is the most popular form of bank lending.
Secondary functions :
a) Agency services:
Banks act as agents, correspondents and representatives of their customer. As an agent a commercial bank collect and pay cheques, drafts, bills and pay insurance pre-mium subscriptions, rent, income tax etc, as per the instruction of their customers. Banks also act as trusties executors and attorneys.
b) General utility services : Banks provide some general utility services like :
- Locker facility the safe custody and valuables.
- Issue traveller’s cheques and drafts
- Transfer of funds.
- Acting a referee to the financial standing of customers
- Issue letters of credit
- Finance foreign trade by discounts foreign bills of exchange.
Section – B
II. Answer any Eight of the following questions in not exceeding 20 lines each. (8 × 5 = 40)
Question 6.
Explain the circular flow of income with suitable diagram.
Answer:
Income is a flow over a period of time. Income flow is of circular in character. Where beginning and end cannot be traced. National output originates in private and public sectors. It moves to the households. The household is the basic consuming unit in economic life. In every economy income flows from house holds to firms and vice verse. Thus the factor market and the product market are closely related to each other. The circular flow of income can be explained with the help of the following diagram
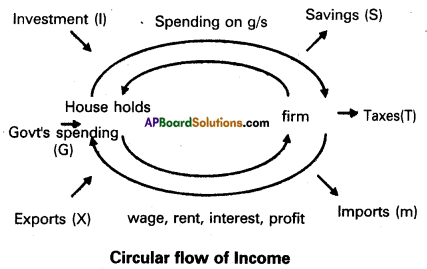
According to the above diagram, it is clear that the factor market and commodity market are closely related to one another. The households supply the resource services and receives in return payment interms of money. Thus money flows from producing units to households. The household exchange that money for goods and services they want. As a result the money flows from households to firms thus. There is a circular flow of income output
![]()
Question 7.
Explain various forms of price elasticity of demand.
Answer:
Alfred marshall developed the concept of price elasticity of demand. Price elasticity measures, other things remaining constant change in the demanded of a good in response to a change in its price. Thus price elasticity of demand is the ratio of percentage change in quantity demanded of a good and percentage change in its price. Price elasticity can be written as stated below.

where q = quantity ; p = price; ∆q = change in demand .
∆ = change in price
Types of price elasticity of demand :
Based on numerical value, price elasticity of demand can be five types.
- Perfectly Elastic demand (Ed = ∝)
- Perfect Inelstic demand (Ed = 0)
- Unitary Elastic demand (Ed = 1)
- Relatively Elastic demand (Ed > 1)
- Relatively Inelastic demand (Ed < 1)
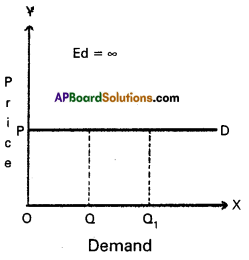
1) Perfectly Elastic demand:
It is also known as “infinite elastic demand”. A small change in price leads to an infinite change in demand is called perfectly elastic demand. It is horizontal straight line to ’X’ axis. The numerical value of perfectly elastic demand is infinite (Ed = ∝)
In the diagram, Ed = \(\frac{\mathrm{OQQ}_1}{\mathrm{OQ}} \div \frac{\mathrm{O}}{\mathrm{OP}}\)
= \(\frac{\mathrm{QQ}_1}{\mathrm{OQ}} \times \frac{\mathrm{OP}}{\mathrm{O}}=\infty\)
2) Perfectly Inelastic de-mand:
It is also known as “zero elastic demand”. In this case even a great rise or fall in price does not lead to any change in quantity demanded is known as perfectly inelastic demand. The demand curve will be vertical to the Y axis. The numerical value is ’O’. This can be shown in the following diagram.
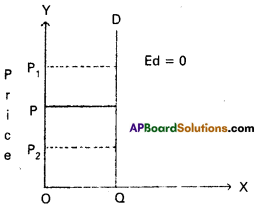
In the diagram Ed = \(\frac{\text { Zero }}{\mathrm{OQ}} \div \frac{\mathrm{PP}_1}{\mathrm{OP}}=0\)
∴ Ed = 0
3) Unitary Elastic demand:
The percentage change in price leads to same percentage change in demand is called unitary elastic demand. In this case the elasticity of demand is equal’to one. The shape of demand curve is “Rectangular Hyperbola”. This can be shown in the following.
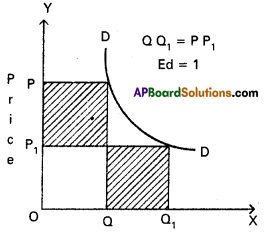
In the diagram, Ed = OP1Q1 = OPQ
(or) OQ1 = PP1
∴ Ed = 1
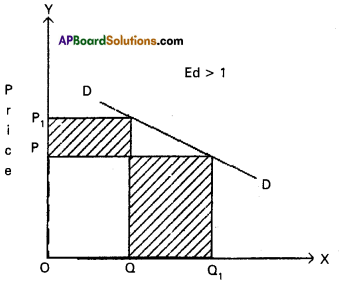
4) Relatively Elastic demand:
When a percentage change in price leads to more than percentage change in quantity demand is called relatively elastic demand. In this case the numerical value of (Ed>1)
In the diagram, Ed = OQ1 > PP1
∴ Ed > 1
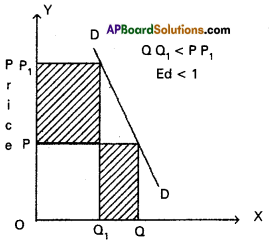
5) Relatively Inelastic demand:
When the percen tage change in price leads to a less than percentage change in quantity demand is called rela¬tively inelastic demand. Here the numerical value is less than one (Ed < 1). This can be shown to following diagram.
Question 8.
Draw an indifference curve with the help of an indifference schedule.
Answer:
Indifference curve shows the various combinations of two comodities which yield equal utility or satisfaction to the consumer.
Indifference schedule:
According to A.L. meyers “An .indifference schedule may be defired as schedule of various combinations of goods that will be equally satisfactory to the individual concerned”. This can be explained with the help of a table and diagram.
| Combinations | Number of x | Number of y |
| A | 1 | 20 |
| B | 2 | 15 |
| C | 3 | 11 |
| D | 4 | 8 |
| E | 5 | 6 |
| F | 6 | 5 |
In the above sheduel the-consumer gets as much total satisfaction from combination A and as well as from other combinations B, C, D, E and F, the total satisfaction is seeme in all these combinations. Since consumer get same satisfaction he is indifferent to select any one of the combinations. Therefore this may be called “weak ordering”.
Indifference curve :
with the help of the above table we can draw an indifferent curve to study its properties.
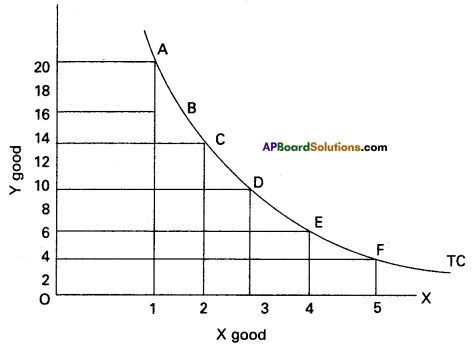
In the side diagram ‘X’ good are shown on ‘OX’ axis ; and y’ good shown on ‘OY axis. IC is the indifferent curve. A, B, C, D, E, and, F are the various combinations of x and y. The points on indifference curves give the consumer the equal level of satisfaction of various points is the same that isA = B = C = D = E = F.
![]()
Question 9.
What are the methods of price ‘discrimination.
Answer:
Price discrimination refers to the practice of a monopolist v charging different prices for different customers of the same product. In the words of Joan Robinson “The act of selling the same article, produced under single control at different prices to differ-ent buyers is known as price discrimination”. Price discrimination is of three types. 1. Personal 2. Local
3. Use or trade discrimination.
1) Personal discrimination:
When a seller charges different prices from different persons. Ex : A book is sold ₹ 15/- to one person and other person at discount rate of ₹ 12/-
2) Local discrimination:
When a seller charges different prices from people of different localities or places. Ex : Dumping.
3) Use discrimination: When different prices of commodity are charged according to the uses to which the commodity is put is known discrimination is according to use. Ex: Electricity is sold at a cheaper rate for uses of domestic purposes than for industrial purposes.
Question 10.
Write any five features of monopolistic competition.
Answer:
It is a market with many sellers for a product but the products are different in certain respects. It is mid way of monopoly and perfect competition. Prof. E.H. Chamberlin and Mrs. Joan Robinson pioneered this market analysis.Characteristics of Monopolistic competition :
- Relatively small number of firms : The number of firms in this market are less than that of perfect competition. No one should not control the output in the market as a result of high competition.
- Product differentiation: One of the features of monopolis¬tic competition is product differentiation. It take the form of brand names, trade marks etc. It cross elasticity of demand is very high.
- Entry and exit: Entry into the industry is unrestricted. New firms are able to commence production of very close substitutes for the existing brands of the product.
- Selling cost: Advertisement or sales promotion technique is the important feature of Monopolitic competition. Such costs are called selling costs.
- More Elastic Demand: Under this competition the demand curve slopes downwards from left to the right. It is highly elastic.
Question 11.
Explain the components of gross profit and net profits.
Answer:
Gross profit is considered as a difference between total revenue and cost of production. The following are the components of gross profit.
- The rent payable to his own land or buildings includes gross profit.
- The interest payable to his own business capital.
- The wage payable to the entrepreneur for his management includes gross profit.
- Depreciation charges or user cost of production and insurance charges are include in gross profit. Net profits are reward paid for the organiser’s entrepre-neurial skills.
Components :
- Reward for risk bearing: Net profit is the reward for bearing uninsurable risks and uncertainities.
- Reward for coordination: It is the reward paid for co-ordinating the factors of production in right proportion in the process of production.
- Reward for marketing services: It is the profit paid to the entrepreneur for his ability to purchase the services of factors of production.
- Reward for innovations the reward paid for innovations of new products and alternative uses to natural resources.
- Wind fall gains: These gains arise as a result of natural calamities, wars and artificial scarcity are also include in net profits.
![]()
Question 12.
Write a note on the supply of money.
Answer:
The term supply of money is related to stock concept. There may be increase or decrease in the money stock over a period of time. Money supply determines the various factors i.e., rate of interest, credit availability, investment, national income and employment. This affects the general price level.
Components of money supply:
1) Currency issue by the Central Bank:
Central Bank is the apex bank and enjoys the power of issue of currency. Currency consists of paper notes and coins. In India, RBI is the Central Bank and issue notes in the denominations of 1000, 500, 100, 50, 20, 10, 5 and 2 rupees. The one rupee note and coins are issued by the finance department of the government of India.
2) Demand deposits created by Commercial banks:
Bank deposits are also considered as money supply. Commercial banks collect deposits from the public and creates credit out those deposits. Credit in this form is called derived or secondary depos-its. This constitute nearly 80% of total money supply.
Monetary aggregates:
In India money supply measured in terms of the following monetary aggregates.
M1 = Currency + demand deposits + other deposits
M2 = M1 + time liability portion of saving deposits with banks + certficates of deposits issued by banks + terms deposits maturing within one year.
M3 = M2 + term deposits over one year maturity + call term borrowings of banks.
M1, M2 and M3 as monetary measures.
Question 13.
Distinguish between aggregate supply price and aggregate demand price.
Answer:
Aggregate supply price : When an entreprenuer gives employment to certain amount of labour. It requires the use of other factors of production or inputs. All these inputs have to be paid remunerations. When all these are added what we get is the value of the output produced or the expenditure incurred to supply employment for a specific number of labourers. By selling the output the extrepreneurs must expect to receive atleast what they have spent. This is known as the Aggregate supply price” of the output or level of employment. As the level of employment, aggregate supply price also increases with every increase in the level of employment.
Aggregate demand price:
In keynes theory the aggregate demnad determines the level of employment. The aggregate demand price for a given output is the amount of money which the firms expect to receive from the sale of that output. Then aggregate demand will be equal to the sum of consumption (c) investment (I) and Government Expenditure (G) for goods and services. Therefore Aggregate Demand (AD) = C + I + G As the level of employment rises, the total income of the community also rises and therefore the aggregate demand price also increases.
![]()
Question 14.
Explain the concept of the legal tender money.
Answer:
Based on the legality money is divided into legal tender money and optional money.
Legal tender money is that money which is accepted by the people as per law while paying the amount for goods and services. This is further divided into two types. They are :
1) Limited legal tender money.
2) Unlimited legal tender money.
1) Limited legal tender money:
The money which no persons can be forced to accept beyond a certain limit. The maximum limit for acceptance will be decided by the government.
For Ex: 5 paise, 25 paise etc. The limit in case of these coins is 25 rupees.
2) Unlimited legal tender money:
This money which everyone should accept without any limit in payment of goods and services.
Ex : 1 rupee paper note, 5 rupee coins, 2 rupee coins etc.
Question 15.
State the objectives of a Central Bank.
Answer:
Central bank is the apex bank of the baning system in a country. It controls, regulates and supervises the activities of the banks in the banking system of a country. The following are the objectives of the central bank.
- Maintaining the internal value of currency.
- Preserve the external value of currency.
- Ensure price stability.
- Promote economic development.
- Develop financial institutions.
Question 16.
Explain the different types of loans and advances paid by the commercial banks.
Answer:
According or crowlter “A bank is a dealer in debts his own and other people”.
Banking means the accepting for the purpose of lending or investment of deposits of money from the public repayable demand or otherwise and with drawable by cheque, draft or afterwise.
Advancing loans:
Commercial Banks release funds so collected for productive purposes by way of loans and advances. Commercial bank usually lend money by way of loans, cash credit overdrafts and by discounting bills of exchange.
a) Cash credit:
In this cas^ the borrower is given a loan is deposited in his account in the bank. The loan is net normally paid in cash. The borrower can draw money out of this account as per his needs.
b) Overdrafts:
It means allowing the depositor to overdraft his account upto a previously agreed limit. Banks allow overdraft only to those persons who have their accounts in the bank.
c) Loans:
Usually a loan is a granted against the securities of assests or personal security of borrowed bank loans and advances carry a high rate of interest. In addition banks grant call loans for every short period term loans for longer period and also grant consumer credit for buying durable goods.
d) Discounting bills of exchange:
The bank facilities trade and commerce by discounting the bills of exchange. This is the most popular form of bank lending.
Question 17.
Explain the geomatric diagram? What are Bar diagrams and pie diagrams.
Answer:
Diagrams are more suitable to illustrate the data which is discrete, while continuous data is better represented by graphs. BAR DIAGRAM and PIE DIAGRAM come in the category of geometric diagrams. The bar diagram are 3 types. Simple, Multiple and Compo-nent bar diagrams.
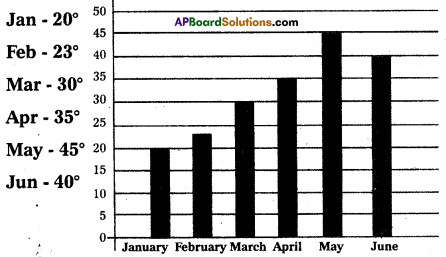
Simple Bar Diagrams: Bar diagrams are very commonly used and is better for representation of quantitative data. Bars are simply vertical lines, where the lengths of bars are proportional to their corresponding numerical values.
Ex : Maximum temperature recorded in Hyderabad in the 1st six months in a year in a bar diagram.
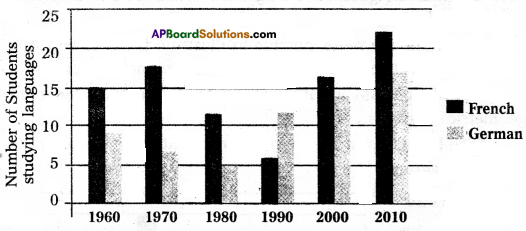
Multiple Bar Diagram:
Multiple bar diagrams are used for comparing two or more sets of data. Ex: The multiple bar diagram depicts the number of students in a college studying two foreign languages, French and German for the period 1960 – 2010 is given below.
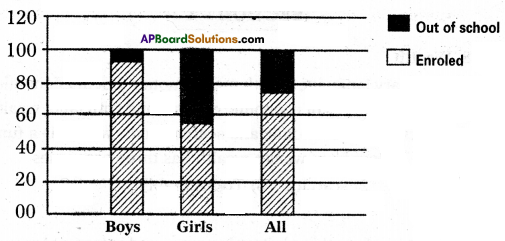
Component Bar Diagram:
Component bar diagram charts also called sub-divided bar diagram, are very useful in comparing the sizes of different component parts. Ex : Enrolment at primary level in a district of Bihar. Boys, girls and total children in the given age group are denoted in the component bar diagram is given below.
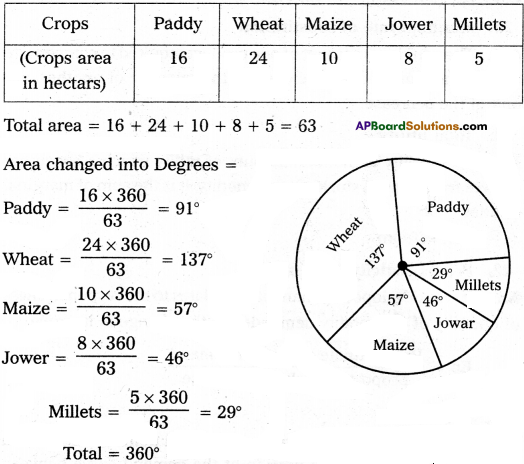
Pie – Diagram: This diagram enables us to show the partitioning of total into component parts. It is also called a pie chart. Ex : Draw the pie digram for following data.
Section – C
III. Answer any fifteen of the following questions in not exceeding 5 lines each. (15 × 2 = 30)
Question 18.
Wealth
Answer:
Inordinary language wealth means money. But in Economics wealth means all kinds of economic goods along with land, wealth in economics means economic and scarce goods, wealth is a fund and income is flow from wealth wealth has three properties 1) utility 2) scarcity 3) Tremsferability.
Question 19.
Price
Answer:
The price of anything is its value measured in terms of money i.e. the value of a commodity expressed in terms of money.
For Ex : a commodity is exchanged for 50 rupees then the price of commodity is 50 rupees.
Question 20.
Marginal rate of substitution
Answer:
The additional amount of one product required to compensate a consumer for a small decrease in the quantity of another, per unit of the decrease.
![]()
Question 21.
Total utility
Answer:
Total utility is the total amount of utility which a consumer derives from a given stock of acommodity. It is the sum of marginal utilities.
Tun = f(Qn)
Question 22.
Price Elasticity of Demand
Answer:
It was developed by marshall. It relates to the responsiveness of quantity of commodity demanded to the change in its price.
Ep =
Proportinate change in demand
proportinate change in price
Question 23.
Arc method
Answer:
Arc method is the elasticity at the mid point of an Arc of a demand curve it studies a portion of the demand curve between two points. This is used when the change in price is not very large.
Question 24.
Tax.
Answer:
Tax is a compulsory payment collected from individuals or firms by central, state and local governments.
Question 25.
Fixed costs
Answer:
The cost of production which remains constant even the production may be increase or decrease is known as fixed cost. The amount spent by cost of plant, equipment etc are treated as fixed cost.
![]()
Question 26.
Average Revenue
Answer:
Average Revenue is the revenue per unit of output. Average revenue is obtained by dividing total revenue of the number of units sold. AR = TR/Q
Question 27.
Duo poly
Answer:
When there are only two sellers of a product, there exists duopoly. Each seller under duopoly must consider the other firms reaction to any changes that he may make in price or output. They make decisions either independently or together.
Question 28.
National market
Answer:
A national market is said to exist when a commodity is demanded and supplies all over our country. For Ex: wheat, sugar etc.
Question 29.
Time wages
Answer:
If wages are paid according to the period of time such typed wages are called time wages. They tend to be uniform in case of similar work. They are paid to workers according to their contract, but not to their efficiency. They may be paid either on daily, weekly monthly or yearly basis.
Question 30.
Capital
Answer:
Capital is the part of wealth other than land which is used for further production.
Question 31.
Depreciation
Answer:
Firms use continuously machines and tools for the production of goods and services. This results in a loss of value due to wear and tear of fixed capital. This loss suffered by fixed capital is called depreciation.
![]()
Question 32.
Classical Economics
Answer:
The term classical economics refers to the body of economic goods which held their influence from the latter half of the 18th century to the early part of 20th century. The most important principle of classicism are personal liberty and private property etc.
Question 33.
Primary deficit
Answer:
Primary deficit is the fiscal deficit minus the internet payments.
Question 34.
Reserve Bank of India
Answer:
R.B.I. is the Central Bank of India. It was established in 1935 with a share capital of Rs. 5 crores. It was nationalised in 1949.
Question 35.
Bill of Exchange
Answer:
Bill of Exchange are the written undertaking received by the seller from the buyer against the credit transactions. Undertakes regarding the payment of money after certain period of time. The . person one who possess bill com discount the bill in the bank if they need money.
Question 36.
Find the mode when median is 125.6 and mean is 128.
Answer: mode = 3 median – 2 mean
= (3 × 125.6) – (2 × 128)
= 376.8-256 = 120.8
mode = 120.8
Question 37.
Find the mode for the data 17, 6, 19, 14, 8, 6, 12, 15, 6, 16.
Answer:
mode = 6. Because ’6′ occuring many times ie., 3 times.