The strategic use of AP Inter 1st Year Economics Model Papers Set 2 allows students to focus on weaker areas for improvement.
AP Inter 1st Year Economics Model Paper Set 2 with Solutions
Time: 3 Hours
Maximum Marks: 100
Section – A
I. Answer any Three of the following questions in not exceeding 40 lines each. (3 × 10 = 30)
Question 1.
Explain consumer’s equilibrium with the law of equimarginal utility.
Answer:
Law of equi-marginal utility is an important law of consumption. It is called as “Gossen’s with the name of H.H.Gossen. According to Marshall “If person has a thing which can be put to several uses, he will distribute it among these uses in such a way that it has the same marginal utility in all uses. If it had a greater marginal utility in one use than in another, he would gain by taking away some of it from the second and applying it to the first”.
According to this law the consumer has to distribute his money income on different uses in such a manner that the last rupee spent on each commodity gives him the same marginal util-ity. Equalisation of marginal utility in different uses will maximise his total satisfaction. Hence this law is known as “law of equi-mar-ginal utility”.
Assumptions of the law : The law of equi-marginal utility depends on the following assumptions.
- This law is based on cardinal measurement of utility.
- Consumer is a national man always aiming at maximum satisfaction.
- The marginal utility of money remains constant.
- Consumer’s income is limited and he is proposed to spent the entire amount on different goods.
- The price of goods are unchanged.
- Utility derived from one commodity is independent of the utility of the other commodity.
The fundamental condition for consumer’s equilibrium can be explained in the following way.
\(\frac{\mathrm{MU}_{\mathrm{x}}}{\mathrm{P}_{\mathrm{x}}}=\frac{\mathrm{MU}_{\mathrm{y}}}{\mathrm{P}_{\mathrm{y}}}=\frac{\mathrm{MU}_{\mathrm{z}}}{\mathrm{P}_{\mathrm{z}}}\) = MUm
Where MUx, MUy, MUz, MUm = marginal utility of commodi-ties X, Y, Z, m;
Px Py, Pz = prices of x, y, z.
This law can be explained with the help of a table. Suppose the consumer is prepared to spend his money income is ₹ 26/- on two goods x and y. Market prices of two goods are ₹ 4/- & ₹ 5/- respec-tively. Now the marginal utilities of goods x & y are shown below.
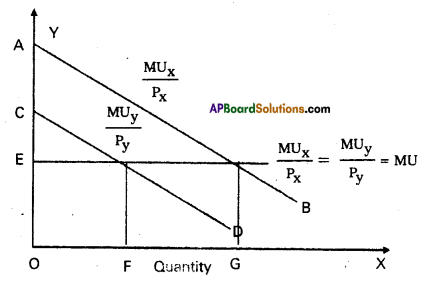
| Units Ux | MUx | Units Uy | MUy |
| 1 | 44 | 1 | 45 |
| 2 | 40 | 2 | 40 |
| 3 | 36 | 3 | 35 |
| 4 | 32 | 4 | 30 |
| 5 | 28 | 5 | 25 |
For. explaining consumer’s maximum satisfaction and conse-quent equilibrum position we need to reconstruct the above table dividing marginal utilities of x its price ₹ 4/- and marginal util- r of y by ₹ 5/-. This is shown in the following table.
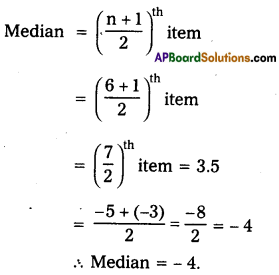
In the table it is clear that when consumer purchase 4 units of goods x & 2 units of good y. Therefore, consumer will be in equilibrium when he is spending (4 × 4 = 16 + 2 × 5 = 10)₹ 26 on them. Consumer’s equilibrium may be shown in the diagram.
In the diagram marginal utility curves of goods slope down-wards i.e. AB & CD taking the income of the consumer as given, suppose his My of money constant at OE. \(\frac{M U_x}{P_x}\)
is equal to OE
when OG quantity of good X is brought. \(\frac{\mathrm{MU}_{\mathrm{y}}}{\mathrm{P}_{\mathrm{y}}}\) is equal to OE, when OF quantity of good y is purchased. Thus consumer pur-chasing OG of X and OF of Y. \(\frac{\mathrm{MU}_{\mathrm{x}}}{\mathrm{P}_{\mathrm{x}}}=\frac{\mathrm{MU}_{\mathrm{y}}}{\mathrm{P}_{\mathrm{y}}}\) = MUm This is consumer’s equilibrium.
![]()
Question 2.
Explain short-run cost structure of a firm.
Answer:
Costs are divided into two categories i.e.,
1. Short run cost (curves)
2. Long run cost (curves).
In short run by increasing only one factor i.e., (labour) and keeping other factors constant.
The short run cost are again divided into two types.
1. General costs
2. Economic costs.
- General costs:
- Money costs:
Production is the outcome of the efforts of factors of production like land, labour, capital and organisation. So rent to land, wage to labour, interest to capital and profit to entrepreneur has to paid in the form of money is called money cost. - Real cost:
Adam Smith regarded pains and sacrifices of labour as real cost. So it cannot be measured interms of money. - Opportunity cost:
Factors of production are scarce and have alternative uses. The opportunity
cost of a factor is the ben-efit that is foregone from the next best alternative use.
- Money costs:
- Economic costs:
- Fixed costs :
The cost of production which remains con-stant even the production may be increase or decrease is known as fixed cost. The amount spent ‘Ey the cost of plant, equipment, permanent staff are treated as fixed cost. - Variable cost:
The cost of production which is changing according to changes in the production is said to be variable cost. In the long period all costs are variable costs. It include price of raw materials, payment of fuel, excise taxes etc. Marshall called “Prime cost”. - Average cost:
Average cost means cost per units of out-put. If we divided total cost by the number of units produced, we will get average cost. AC = \(\frac{\text { Total } \cos t}{\text { Output }}\) - Marginal cost:
Marginal cost is the additional cost of production producing one more unit.
MC = \(\frac{\Delta \mathrm{TC}}{\Delta \mathrm{Q}}\) - Total cost:
Total cost is the sum of total fixed cost and total variable cost.
TC = FC + VC
- Fixed costs :
The short term cost in relation to output are explained with the help of a table.
| Output (Q) | Total Fixed cost (FC) | Total Variable cost (VC) | Total cost | Average cost (AC) | Marginal cost (MC) |
| 1 | 30 | 5 | 35 | 35 | 35 |
| 2 | 30 | 8 | 38 | 19 | 3 |
| 3 | 30 | 10 | 40 | 13.3 | 2 |
| 4 | 30 | 14 | 44 | 11 | 4 |
| 5 | 30 | 24 | 54 | 10.8 | 10 |
| 6 | 30 | 40 | 70 | 11.6 | 16 |
In the above table shows that-as output is increased in the 1st column, fixed cost remains constant. Variable costs have changed as and when there are changes in output. To produce more output in the short period, more variable factors have to be employed. By adding FC & VC we’get total cost different levels of output. AC falls output increases, reaches its minimum and then rises MC also change in the total cost associated with a change in output. This can be shown in the diagram.
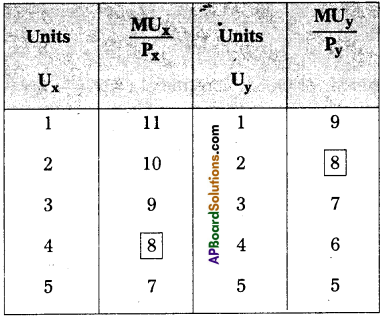
Fixed Cost, Variable Cost, Total Cost
In the above diagram on ’OX’ axis taken by output and ‘OY taken by costs. The shapes of different cost curves explain the relationship between output and different costs. TFC is horizontal to ’X’ axis. It indicates that increase in output has no effect on fixed cost. TVC on the other side increases along with level of output. TC curve rises as output increases.
Question 3.
Describe price determination under imperfect competition.
Answer:
Monopoly is one of the market in the imperfect competition. The word ‘Mono’ means single and Poly means seller. Thus monopoly means single seller market.
In the words of Bilas “Monopoly is represented by a market situation in which there is a single seller of a product for which there are no close substitutes, this single seller is unaffected by and does not affect, the prices and outputs of other products sold in the economy”. Monopoly exists under the following conditions.
- There is a single seller of product.
- There are no close substitutes.
- Strong barriers to entry into the industry exist.
Features of monopoly:
- There is no single seller in the market.
- No close substitutes.
- There is no difference between firm and industry.
- The monopolist either fix the price or output.
Price determination:
Under monopoly the monopolist has complete control over the supply of the product. He is price maker who can set the price to attain maximum profit. But he cannot do both things simultaneously. Either he can fix the price and leave the output to be determined by consumer demand at a particular price. Or he can fix the output to be produced and leave the price to be determined by the consumer demand for his product. This can be shown iiythe diagram.
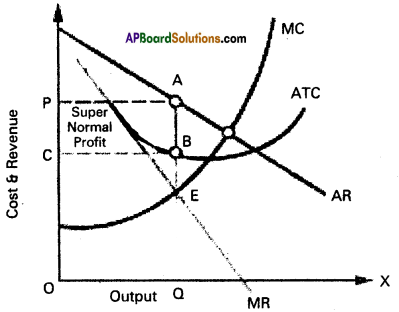
In the above diagram on ‘OX’ Sxis measures output and ‘OY axis measures cost. AR is Average Revenue Curve, AC is Average Cost Curve. In the above diagram at E point where MC = MR at that point the monopolist determine the output price is determine where this output line touches the AR line. In the above diagram for producing OQ quantity cost of production is OCBQ and revenue is OPAQ.
Profit = OPQA – OCBQ = CPAB shaded area.
![]()
Question 4.
Define National Income and explain various concepts of National Income.
Answer:
National Income means the aggregate value of all the final goods and services produced in the economy in one year.
Concepts of National Income :
1) Gross National Product (GNP): It is the total value of all final goods and services produced in the economy in one year.
The main components of GNP are :
a) The goods and services purchased by consumers – C.
b) Investments made by public and private sectors – I.
c) Government expenditure on public utility services – G.
d) Incomes earned through International Trade (x – m).
e) Net factor incomes from abroad.
GNP at market prices = C + I- G+ (x – m) + Net factor income from abroad.
2) Gross Domestic Product (GDP):
The market value of the total goods and services produced in a country in one particu¬lar period usually in a year is the GDP.
GDP = G + I + G
3) Net National Product(NNP):
Firms use continuously machines and tools for the production of goods and services. This result in a loss of value due to wear and tear of fixed capital. The loss suffered by fixed capital is called depreciation. When we substract depreciation from GNP we get NNP.
NNP = GNP – depreciation.
4) National Income at factor cost:
The cost of production of a good is equal to the rewards paid to the factors which partici-pated in the production process. So the cost of production of a firm is the rent paid land, wages paid labour, interest paid on capi-tal and profits of the entrepreneur.
National Income at factor cost = NNP + Subsidies – Indirect Taxes – Profits of Govt, owned firms.
5) Personal Income:
It is the total of incomes received by all persons from all sources in a specific time period. Personal income is not equal to National Income. Because social security payments. Corporate taxes, undistributed profits are deducted from national income and only the remaining is received by persons.
Personal Income = National Income at factor cost – Undistributed profits – Corporate taxes – Social security contributions + Transfer payments
6) Disposable income:
Personal income totally is not avail-able for spending income tax is a payment which must be deducted to obtain disposable income.
Disposable income = Personal income – Personal taxes D.I = Consumption + Savings
7) Percapita income:
National Income when divided by country’s population. We get percapita income.
Percapita income = \(\frac{\text { Nation Income } \cos t}{\text { Total Population }}\)
The average standard of living of a country is indicated by percapita income.
Question 5.
Describe the various methods of redemption of public debt.
Answer:
Redemption of public debt means repayment of public debt. All government debts should be rapid promptly. There are various methods of repayment which may be discussed under the follow-ing heads.
1) Surplus budget:
Surplus budget means having public revenue in excess of public expenditure. If the government plans for a surplus budget, the excess revenue may be utilized to repay public debt.
2) Refunding:
Refunding implies the issue of fresh bands and securities by government so that the matured loans can be used for repayment of public debt.
3) Annuities:
By this method, the government repays past of the public debt every year. Such annual payments are made regularly till the debt is completely cleared.
4) Sinking fund:
By this method, the government creates a separate fund called ‘Sinking fund’ for the purpose of repaying public debt. This is considered as the best method of redemption.
5) Conversion:
Conversion means that the existing loans are changed into new loans before the date of their maturity.
6) Additional taxation:
Government may resort to addi-tional taxation so as to raise necessary funds to repay public debt under this method new taxes are imposed.
7) Capital levy:
Capital levy is a heavy one time tax on the capital assets and estates.
8) Surplus Balance of payments:
This is useful to repay external debt for which foreign exchange is required surplus bal-ance of payment implies exports in excess of imports by which reserves of foreign exchange can be created.
Section – B
II. Answer any Eight of the following questions in not exceeding 20 lines each. (8 × 5 = 40)
Question 6.
Define Prof. Samuelson’s growth definition.
Answer:
Robbin’s definition does not take into consideration the dynamic of economic growth. As the time passes the scarcity of means ends, targets choices undergo a change. The inherent defect of Robbins definition has been rectified by Paul Samuelson in his definition of economics.
Prof. Paul Samuelson, a Nobel Prize winner of 1970 provided a new definition of economics in which he introduced time element and it is dynamic in nature. Therefore his definition is known as growth oriented definition.
According to Samuelson’s economic is the study of how people and society choosing with or without the use of money, to employ scarce productive resources that could have alternative use to produce various commodities and distribute them for consumption. Now or in the future among various persons and groups in society.
Important features of the definition :
- Scarcity:
Like Robbins, Samuelson emphasises the scarcity of resources, unlimited wants and the alternative uses for the meAnswer: - Dynamism:
Samuelson’s definition is dynamic. He talks about production, distribution and consumption in the present and also in the future - Wide scope:
This definition widen the scope of economics. It deals with problems-of choice in a dynamic society. - Economic growth:
He importance to economic growth the future consumption is safeguard by productive investment which leads to economic growth. Thus Samuelson definition of economics is considered to be the most satisfactory definition of economics as it clearly states.
Question 7.
What are the characteristics of human wants?
Answer:
Human wants are starting point of all economic activities. They depend on social and economic conditions of individuals.
Characteristic features of wants :
1) Unlimited wants:
Human wants are unlimited. There is no end to human wants. When one want is satisfied another want taken its place. Wants differ from person to person time to time and place to place.
2) A particular want is satisable:
Although a man cannot satisfy all his wants, a particular want canbe satisfied completely in a period of time. Ex : If a person is thirsty he can satisfy it by drinking a glass of water.
3) Competition:
Human wants unlimited. But the means to satisfy them are limited of scarce. Therefore they complete with each other in priority of satisfaction.
4) Complementary:
To satisfy a particular want we need a group of commodities at the same time. Ex : Writing need is satisfied only when we have pen, ink and paper together.
5) Substitution:
Most of our wants can be satisfied by different ways. Ex : If we feel hungry, we take same fo 1 and satisfy this want.
6) Recurring:
Many wants appear again and again thought they are satisfied at one point of time.
![]()
Question 8.
Define price line.
Answer:
The budget / price line shows all possible combinations of two goods that a consumer can buy, with given income of the con-sumer and prices of the two goods. But which particular combina-tion of two goods on IC he can get depends on two factors.
1. Consumer’s money income
2. Prices of two goods.
The concept of budget / price line will be shown in the fol-lowing diagram.
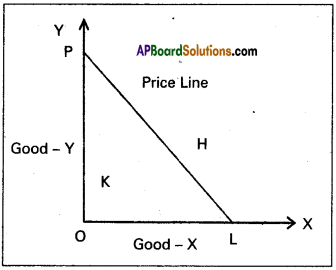
In the beside diagram PL is Budget line. If consumer spend his total income on good X, he could get L. Any point outside the given price line H will beyond the capacity of con¬sumer, K is under spending capacity.
The concept of price line or budget line can be known the following example. Suppose the consumer has ₹ 5/- to buy two goods say X and Y prices of X and Y are ₹ 1/- and 0.50 paisa. Then the following are the opportunities available before him.
Img-1
1) If consumer spends his total amount of ₹ 5 on X only he gets 5 units of X and none of Y.
2) If he spends whole of his money i.e., ₹ 5 on Y only he gets 10 units of Y and none of X.
3) If consumer wants to have both X & Y. Therefore he can move within OAB of price line.
Question 9.
What are the exceptions of law of. demand?
Answer:
In Economics demand means a desire which is backed up by ability to buy and willingness to pay the price. Thus demand will be always at a price and time.
According to Marshall “The amount demanded increases with a fall in price and disminishes with rise in price when other things remain the same”.
Exceptions:
In certain situations, more will be demanded at higher price and less will be demanded at a lower price. In such cases the demand curve slopes upward from left to right which is called an exceptional demand curve. This can be shown in the following diagram.
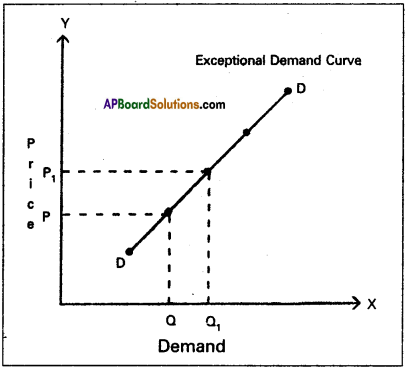
In the diagram when price increases from OP to OP1 demand also increases from OQ to OQ1 This is opposite to law of demand.
1) Giffen’s Paradox:
This was stated by Sir Robert Giffen. He observed that poor people will demand more of inferior goods, if their prices raise. Inferior goods are known as Giffen goods. Ex : Ragee, Jowar etc. He pointed out that in case of the English workers, the law of demand does not apply to bread. Giffen noticed that workers spend a major portion of their income on bread and only small portion on meat.
2) Veblen Effect (Prestigious goods):
This exception was stated by Veblen. Costly goods like diamonds and precious stones are called prestige goods or veblen goods. Generally rich people purchase those goods for the sake of prestige. Hence rich people may buy more such goods when their prices rise.
3) Speculation:
When the price of a commodity rises the group of speculators expect that it will rise still further. Therefore, they buy more of that commodity. If they expect that there is a fall in price, the demand may not expand. Ex : Shares in the stock market.
4) Illusion:
Some times, consumer develop to false idea that a high priced good will have a better quality instead of low priced good. If the price of such good falls, demand decreases, which is contrary to the law of demand.
![]()
Question 10.
What are the basic determinants of Elasticity of demand?
Answer:
The elasticity of demand is the measure of responsiveness or sensitiveness of demand for a commodity to the change in it demand.
Determinants of demand:
1) Nature of commodity:
Commodities can be grouped as necessaries, comforts and luxuries. In case of necessaries, the elasticity of demand will be inelastic. Ex: Rice, salt etc., on the other hand in case of luxuries the demand will be more elastic. Ex : Diamonds & gold etc.
2) Availability of substitutes:
Prices of substitutes influ-ence the demand for a commodity upto a certain extent. The closer
the substitute, the greater the elasticity of demand for the com¬modity. For Ex : Cool drinks, soaps etc., but in case of non-avail¬ability of substitutes the elasticity of demand will be low.
3) Complementary goods:
Price elasticity for a good is also depends on the nature of price elasticity of jointly demand goods. If the demand for car is elastic, then the demand for petrol will also be elastic.
4) Multiple uses of the commodity: The wider the range of alternative use of product, the higher the elasticity of demand and vice-versa. Ex : Coal and electricity have multiple uses and will have elastic demand.
5) Proportion of income spent:
If proportion of income spent on commodity is very small, its demand will be less elastic and vice-versa.
6) Period of time:
In the long run, demand will be more elastic longer the time period considered, greater will be the pos-sibility of substitution for a cheaper good.
7) Price level:
Goods which are in very high range or in – very low range have inelastic demand but it is high at moderate price.
8) Habit:
The demand for a commodity to which the con-sumer is accustomed is generally inelastic. Ex: Tobacco and alcohol.
9) Income group:
The demand of higher income groups will be inelastic as they do not bother about price changes. On the other hand, the demand of middle and lower income groups will be elastic.
10) Postponement of purchase:
The demand for a com-modity the consumption of which can be postponed is more elas¬tic than that of the use of the commodity cannot be postpone the purchases of such goods like life saving medicines.
Question 11.
Explain the concept of distribution.
Answer:
Distribution refers to that branch of economics which analyses how the national income of a community is divided among the various factors of production, distribution then refer to the sharing of the wealth that is produced among factors of production. It is the pricing of factors of production. The distribution of income may be personal or functional economies is concerned with functional distribution. The distribution between them is briefly explained here.
1) Functional distribution:
Functional distribution deals with the study of factor incomes. It means the theory of factor pricing. The prices of land, labour, capital and study and determination of rent, wages, interest and profit. It concern the pattern of distribution of national income as rent, wage, interest and profits. Thus it is not concerned with individuals and their individual income, but with the agents of production. The study of functional shares has been carried on both at the macro and micro levels.
Micro-distribution:
The theory of micro-distribution explains how the prices of factors of production are determined.
Ex : Micro-distribution we study how wage rate of labour is determined.
Macro-distribution:
Macro distribution explains the share of a factor of production in the national income. Ex : The share of labour in the national income.
2) Personal distribution:
It refers to the distribution of income or wealth of a country among its people. It studies how income or wealth is distributed among individuals or persons. It studies how much income is earned by an individual, but not how it is earned or in how many forms it is earned. The causes of income inequalities can be known by studying personal distri-bution.
![]()
Question 12.
What is the relationship between percapita income and population?
Answer:
There is a close relationship between national income and population. These two together determine the percapita income. If rate of growth of national income is 6% and rate of growth of population is 3% the rate of growth of percapita income will be 3% and it can be expressed as follows.
QPC = Q – QP
QPC = Rate of growth of percapita income
Q = Rate of growth of national income
QP = Rate of growth of population
A rise in the percapita income indicates a rise in standard of living. The rise in per capita income is possible only when the rate of growth of population is less than the rate of growth of that national income.
Question 13.
“Supply creates it’s own demand” comment on the statement.
Answer:
Classical theory of employment or the theory of output and employment developed by economists such as Adam Smith, David Ricardo, Robert Malthus etc., it is based on the J.B Say’s law of market’. According to this law “supply creates its own demand”. The classical theory of employment assumes that there is always full employment of labour and other resources.
According to this law the supply always equal to demand it can be expressed as S = D. Whenever additional output is pro-duced in the economy. The factors of production which partici¬pate in the process of production. Earn income in the form of rent, wages, interest and profits.
The total income so generated is equivalent to the total value of the additional output produced. Such income creates addition demand necessary for the sale of the additional output. Therefore the question of addition output not being sold does not arise.
Question 14.
Explain the concept of effective demand.
Answer:
Effective demand means where aggregate demand equals the aggregate supply. When aggregate demand is equal to aggregate supply the economy is in equilibrium. This can be shown in the table
| Level of employment | Aggregate supply price | Aggregate demand price |
| 10 | 500 | 600 |
| 11 | 550 | 625 |
| 12 | 600 | 650 |
| 13 | 650 | 675 |
| 14 | 700 | 700 AD = AS |
| 15 | 750 | 725 |
| 16 | 800 | 750 |
In the above table when the level of employment is 14 lakh workers, aggregate demand price is equal to aggregate supply price i.e ₹ 700 crores. This can be shown in the following diagram.
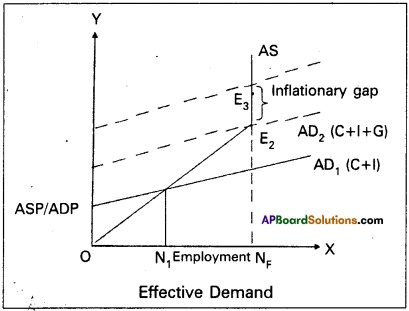
In the above diagram aggregate .demand price curve (AD) and the aggregate. Supply price curve (AS) interest each other at ‘ point Er It shows the equilibrium point. The equilibrium has been attained at ON1 level of employment. It is assumed that ON1 in the above diagram does not indicate full employment as the economy is having idle factors of production. So it is considered as under-employment equilibrium.
According to Keynes, to achieve full employment an upward shift of aggregate demand curve is required. This can be possible through government expenditure on goods and services supplied in the economy, whenever private entrepreneurs may not show interest to invest. With this the AD1 curve (C + I) shift as AD2 (C + I + G) at new point of effective demand E2, where the economy reaches full employment level i.e., ONF.
Question 15.
State the contingent functions of money.
Answer:
Money plays a vital role in modem economy.
According to Waker’ – “Money is what money does”. According to’Robertson’ – “Anything which is widely accepted in payment for goods discharge of other kinds of business obliga-tion”.
Contingent functions :
a) Measurement and distribution of National income:
Na-tional income of a country be measured in money by aggregating the value of all commodities. This is not possible in a barter system similarly national income can be distributed to different factors of production by making payment them in money.
b) Money equalises marginal utilises / productivities:
The consumers can equalize marginal utilities of different commodities purchased by them with the help of money. Similarly firms can also equalize the marginal productivities of different factors of production and maximize profits.
c) Basis of credit:
Credit is created by banks from out of the primary deposits of money supply of credit. In an economy is de-pendent as the supply of nominal money.
d) Liquidity:
Money is the most important liquid asset. Interms of liquidity, it is superior other assets. Money is centpercent liquid.
16. Enumerate the measures for control of inflation.
Answer:
To control the inflation the government has taken various steps. They are
- Increase the production in the long run.
- Implementing proper monetary and fiscal policies to reduce the supply of money and credit.
- Controlling prices and eliminating black markets.
- Importing the goods which are scares in supply from outside countries.
- Introducing rationing and quota system in case of man consumption of goods.
- Distribution of goods to all the needy sections of the people.
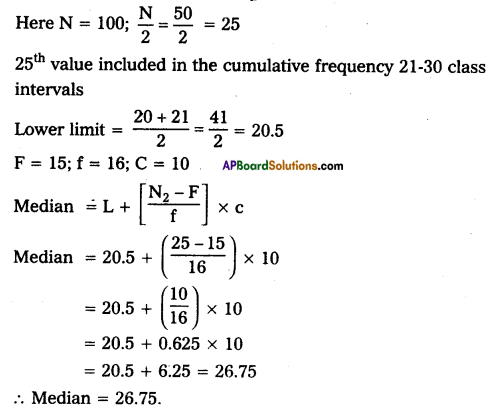
Question 17.
Calculate the median for the following data.

Answer:
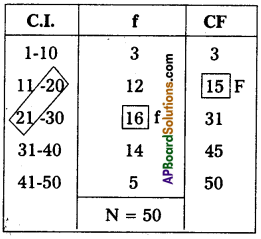
Here N = 100; \(\frac{\mathrm{N}}{2}=\frac{50}{2}\) = 25
25th value included in the cumulative frequency 21-30 class intervals
Section – C
III. Answer any fifteen of the following questions in not exceeding 5 lines each. (15 × 2 = 30)
Question 18.
Micro Economics
Answer:
The term micro economics and macro economics were first coined and used by ‘Ragnar Frisch’ in the year 1933. The word ‘Micro’ is a greek word, it means Very small’. It was developed by Alfred Marshall’. Micro economics is also called as ‘price theory, because it explains pricing in factor market and in product market. It studies about the individual units of the economy like individual income, individual saving, individual investment etc.
Question 19.
Price
Answer:
The value of a commodity expressed in terms of money is known as price. The price of anything is its value measured in terms of a standard money value.
Ex: A pen is exchanged for 10 rupees than the price of that pen is 10 rupees.
![]()
Question 20.
Choice-problem.
Answer:
The choice problem is the centred problem of Economics. The problems of the economy ‘What to produce? How to produce” ? The problem of choice between commodities and the problem of choice of production techniques respectively.
Question 21.
Ordinal utility
Answer:
This was developed by J.R.Hicks, Allen. Utility is subjective and measurement of utility in numerical terms is not possible. We can observe the preference one for a good more than for another.
Ordinal numbers such as 1st, 2nd, 3rd etc. The ordinal numbers are ranked.
Question 22.
Demand function
Answer:
It shows functional relationship between quantity demanded at various factors that determine the demand for a commodity. It can be expressed as follows.
Dx = f<Px,P1 ……. Pn Y,T)
Where
Dx = Demand for good x
Px = Price of x
P1 …. Pn = Prices of substitutes and complementary
Y = Income of consumer
T = Tastes
f = Functional relationship
Question 23.
Income demand
Answer:
It shows the direct relationship between the income of the consumer and quantity demanded when the other factors remain constant. There is direct relationship between income and de¬mand for superior goods. Inverse relationship between income and demand for inferior goods.
Dx = f(y)
Question 24.
Opporunity cost
Answer:
The concept of opportunity cost was first introduced by “Vieser” an Austrian economist. Later it was developed by Knight, Davenport, Wicksteod and Robinson. According to Austrian School of economist opportunity cost is the next best alternative sacrificed in order to obtain that commodity.
Question 25.
Monopoly
Answer:
‘Mono’ means single, ‘poly’ means seller. In this market single seller and there is no close substitutes. The monopolist is a price makfcr.
Question 26.
Selling cost
Answer:
An important feature of monopolistic market is every firm makes expenditure to sell more output. Advertisements through newspapers, journals, electronic media etc. these methods are used to attract more consumers by each firm. This type of expenditure is called selling cost.
Question 27.
Quasi-rent
Answer:
Quasi rent concept used by Marshall. It refers to the short run earnings, man made factors. They are fixed in supply in the short run when demand for them increases, their price. Therefore the earnings of man made factors like machines and tools in short- run depend mainly conditions.
Question 28.
Net interest
Answer:
Net interest is the reward for the service of the capital loan. Ex: Net interest paid on government bonds and government loAnswer:
![]()
Question 29.
Gross National Product
Answer:
It is the total value of all final goods and services produced in economy in one year.
GNP = C + I + G +(x- m)Where
C = consumption
I = Gross National Investment
G = Government expenditure
x = Exports
M = Imports
x – m = Net for eign trade.
Question 30.
Laissezfaire
Answer:
According to classicals the role of government in economic activities should be nominal or very less. The free play of eco-nomic forces it self bring about the fuller utilization of economic resources including labour. Any interference with the free play of market forces under such circumstances the state shall not inter-fere in economic matter. It should pursue a policy of Laissezfaire policy of non-intervention in economic matters.
Question 31.
Effective demand
Answer:
It is that aggregate demand which becomes equal to the ag-gregate supply. This refers to the aggregate demand at equilibrium.
Question 32.
Demand deposits
Answer:
Deposits which are payable on demand with out any prior notice are called demand deposits. They can be transferred from person to person. All current deposists are demand deposits and saving bank deposits are also considered as demand deposits sub-ject to some conditions.
Question 33.
Demand – pull inflation
Answer:
Inflation caused by increase in aggregate demand for com-modities over aggregate supply is called demand pull inflation. Aggregate demand increases due to increase in the income level of the people.
Question 34.
Recurring deposits
Answer:
People will deposit their money in these deposits as monthly installments for fixed period of time. A fixed amount in the mul-tiples of? 10 may be deposited every month for a period one or more years. These deposits carry interest at a rate more than that of savings deposits.
Question 35.
Bar diagram
Answer:
Bars are simply vertical lines, where the lengths of bars are proportional to their corresponding numerical values.
![]()
Question 36.
Statistics
Answer:
In our daily language the word statistics is used in two dis¬tinct senses, singular and plural. In the plural sense “statistics” means “numerical facts systematically collected”. Thus the simple meaning of statistics in plural sense is “data”. The terms statistics in singular same means the “science of collecting, classifying and – using statistics or a statistical fact.
Question 37.
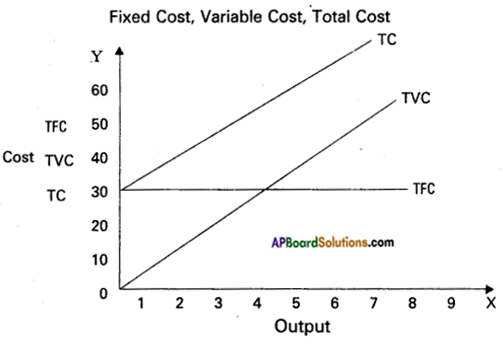
Find the median of the observation -3, -5, -8, 0, 2, -10.
Answer:
Arrange data in Ascending order -10, -8, -5, -3, 0, 2