These TS 8th Class Physical Science Important Questions 12th Lesson Graphs of Motion will help the students to improve their time and approach.
TS 8th Class Physical Science Important Questions 12th Lesson Graphs of Motion
1 Mark Questions:
Question 1.
If the shape of the displacement time graph is parallel to X-axis what does it mean.
Answer:
It means body is at rest.
Question 2.
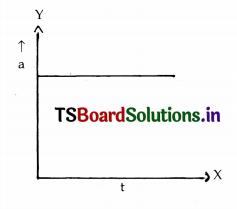
If the shape of the velocity time graph ¡s parallel to X-axis what does it mean.
Answer:
It means body is moving with uniform velocity.
Question 3.
What is the shape of the displacement time graphs for a body moving with uniform velocity.
Answer:
It is always a straight time.
Question 4.
What Is the area under velocity time graph gives.
Answer:
Displacement or distance travelled.
Question 5.
What is the are of acceleration time graph gives.
Answer:
Change in Velocity.
Question 6.
What is the slope of displacement time graph gives.
Answer:
Velocity
Question 7.
What is the slope of velocity line graph gives.
Answer:
acceleration.
Question 8.
What is the slope of acceleration time graph gives.
Answer:
Jerk.
Question 9.
Draw the displacement time graph for freely failing.
Answer:
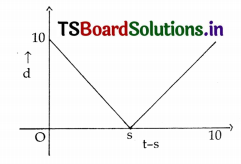
Question 10.
Draw the displacement time graph for vertically projected body.
Answer:
Question 11.
What is the tangent of angle made by displacement time graph with X-axis gives?
Answer:
Slope or velocity.
Question 12.
If the angle made by the displacement time graph is more with X-axis, what does it mean?
Answer:
The body is moving with more velocity.
Question 13.
What is the area of pressure and volume graph gives?
Answer:
Work.
Question 14.
What is the area of Force and Impulse gives?
Answer:
Impulse.
Question 15.
If slope of velocity-time graph is more, what does it mean?
Answer:
It means its acceleration is more.
2 Marks Questions:
Question 16.
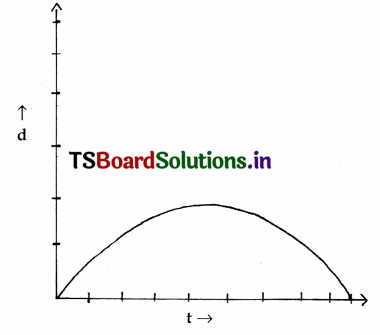
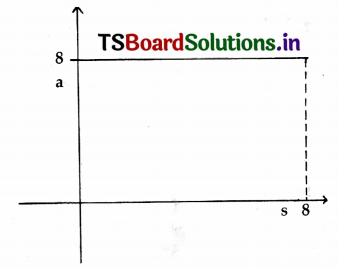
Figure gives here shows the displacement time graph for a particle. Is it practically possible? Explain.
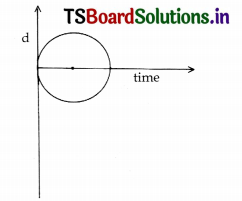
Answer:
From graph, it is evident that at any instant of time, the particle possesses two displacements.
which is impossible.
Question 17.
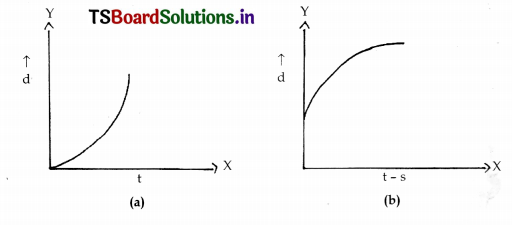
Draw the displacement time graphs for the body moving with
a) Uniform acceleration
b) Uniform retardation.
Answer:
Question 18.
What is the significance of position-time graphs?
Answer:
- The slope of the tangent at any point gives instantaneous velocity.
- The slope of the chord between two points gives average velocity.
Question 19.
A graph Is parallel to X-axis. What does that indicate in
a) displacement time graph
b) velocity time graph?
Answer:
a) Body at rest.
b) Body moving with uniform velocity.
Question 20.
Draw the acceleration time graphs for the bodies
a) Moving with constant acceleration
b) Moving with Non-uniform acceleration.
Answer:
a)
b)
Question 21.
What equations can be derived from velocity time graphs?
Answer:
- v=u+at
- S=ut+\(\frac{1}{2}\) at2
- v2-u2=2as
Question 22.
A particle starts from rest. Its acceleration (a) versus time (t) is as shown in figure. The maximum speed of the particle will be how much?
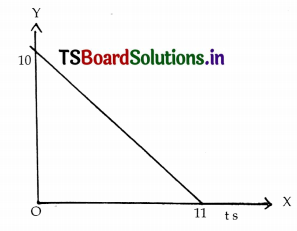
Answer:
From graph acceleration a = 10 meters
time t = 11 seconds
u = 0
V = u + at
∴ v=u+at ⇒ v = 0 + 10 × 11 ⇒ V = 110 m/sec
Question 23.
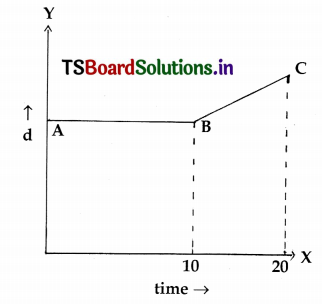
From the following graph what is the information you can draw?
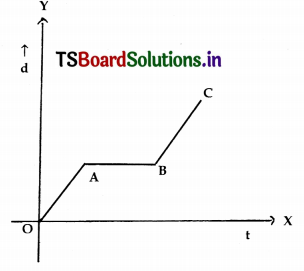
Answer:
a) The velocity during OA and BC part of the journey are equal
b) The body is at arest during AB.
Question 24.
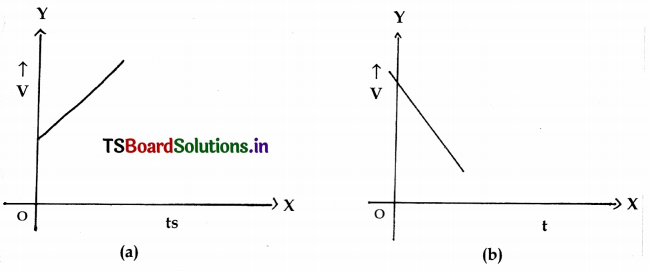
Draw the shapes of the velocity time graphs for the bodies moving with
a) Uniform acceleration
b) Uniform retardation
Answer:
Question 25.
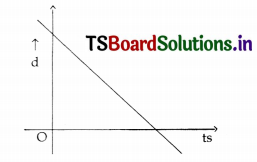
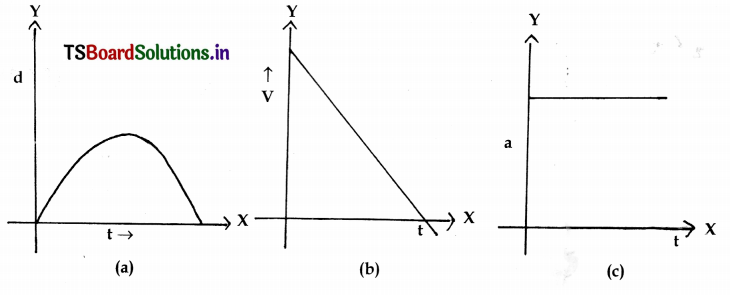
Draw the a) (d – t) b) (y – t) e) (a – t) graphs for the bodies projected upwards.
Answer:
4 Marks Questions:
Question 26.
What is shape of displacement-time graphs when the particle is at rest?
Answer:
it is a straight line parallel to X-axis,
Scale:
On X-axis: 1cm = 2 min
On Y-axis: 1cm = 10 mete
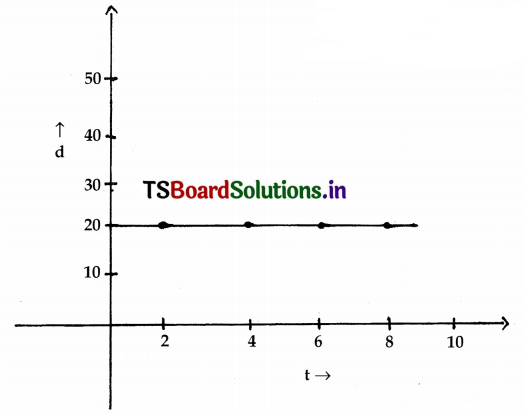
Its initial displacement is 20 meters. There is no change in displacement.
Question 27.
Explain the shape of the displacement-time graph when the body starts from rest and moving with uniform velocity.
Answer:
Here body is stationary from rest and goes on equal displacements in equal intervals of time.
Therefore its velocity is uniform, The displacements can be determined by S = ut.
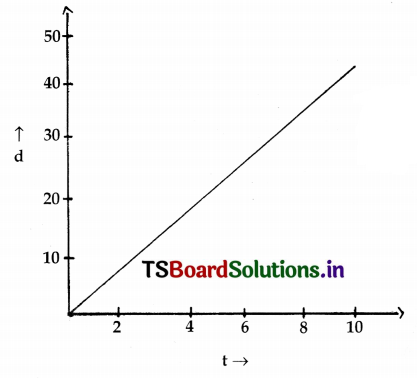
Scale:
On X-axis: 1 cm 2 min
On Y-axis: 1 cm = IC mctcrs
Question 28.
What is the shape of displacement-time graph for the particle which is projected upwards?
Answer:
It is a parabola. Since as time increases the distance travelled by the body while going up decreases because of gravitational force. As it is coming down its distance increases in regular interval of time.
Question 29.
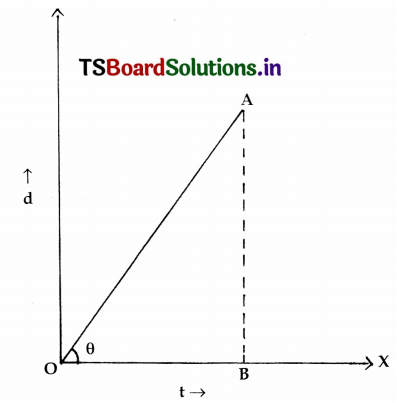
What Is the slope of displacement-time graph?
Answer:
The slope of the displacement time graph is given by
Slope= \(\frac{\mathrm{AB}}{\mathrm{OB}}=\frac{\mathrm{d}}{\mathrm{t}} \)
∴ It is velocity
Question 30.
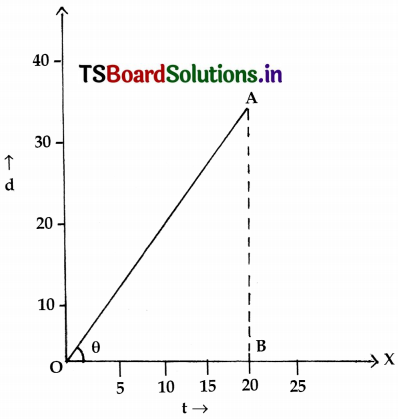
Find the velocity of a body from the displacement-time graph.
Answer:
The velocity of the body is given by slope of the graph.
∴ Slope = \(\frac{\mathrm{AB}}{\mathrm{OB}}\)
Velocity = \(\frac{40}{20} \)
V = 2ms-1
Question 31.
From the following velocity-time graph find out the distance travelled by the body.
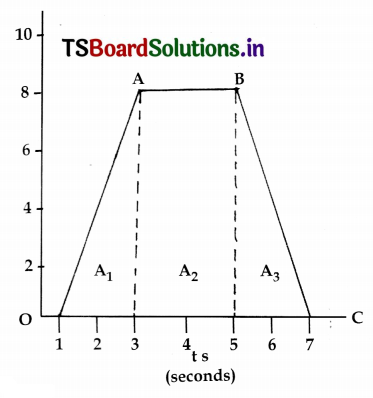
Answer:
Here A1 = \(\frac{1}{2}\) bh
A1 = \(\frac{1}{2}\) × 3 × 8 = 12
A2 = lb = 8 × 2 = 16
A3 = \(\frac{1}{2}\) bh = \(\frac{1}{2}\) × 2 × 8 = 8
∴ Total distance = A1 + A2 + A3 = 12+16+18 = 36 m
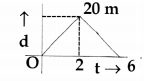
Question 32.
The velocity-time graph of a body moving in a straight line. The displacement and distance travelled by the body in 6 seconds are how much.
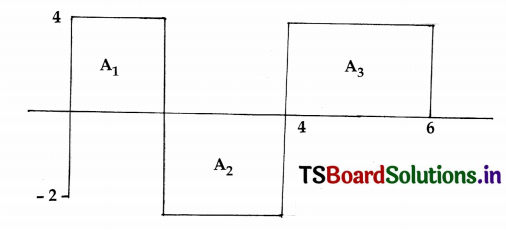
Answer:
From graph
A1 = lb = 2 x 4=8
A2 = lb = 2 x 2=4
A3 = lb = 2 x 4= 8
∴ Displacement = 8 – 4 + 8 = 12 m
Distance = 8+4+8 = 20m
Question 33.
The velocity-time graph of a body is as shown. Find the average distance travelled by the body in the OA and AB interval.
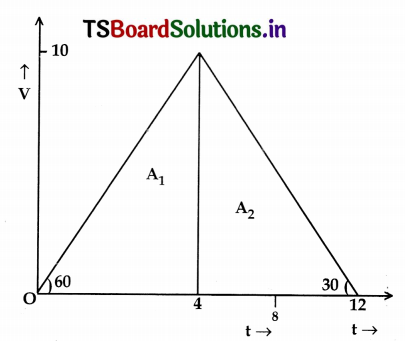
Answer:
A1 = \(\frac{1}{2}\) bh
= \(\frac{1}{2}\) × 4 × 10 = 20
A2 = \(\frac{1}{2}\) bh
= \(\frac{1}{2}\) × 8 × 10 = 40
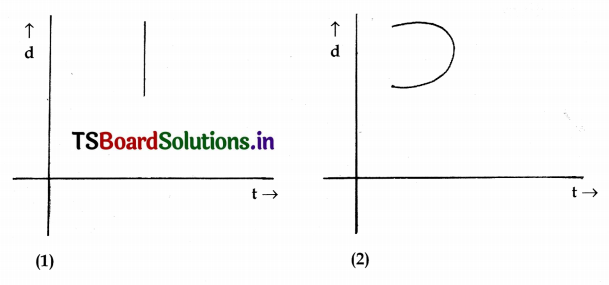
Question 34.
Write any two displacement-time graphs which are not possible.
Answer:
Question 35.
The acceleration-time graph is given as follows. Find the change in velocity.
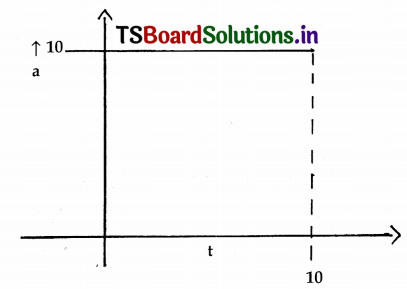
Answer:
The area bounded by the graph gives change in velocity.
Area = l x b
∴ v – u = 1o x 10 = 100
Question 36.
From the following acceleration-distance graph find the value of v2 – u2.
Answer:
The area bounded by the graph gives = a × s
=8 × 8=64
But we know v2 – u2 = 2as
v2– u2 = 2 × 64 = 128
Question 37.
Give any two uses of
a) distance-time graph
b) velocity-time graphs
c) acceleration-time graphs.
Answer:
a) distance time graphs:
- We can find position of the body.
- We can find velocity of the body.
b) velocity-time graphs:
- We can find distance travelled by the body.
- We can find acceleration of the body.
c) acceleration-time graphs:
- We can find change in velocity of the hod.
- We can find jerks on the body.
Multiple Choice Questions
Question 1.
For the displacement-time graph shown in figure, the ratio of magnitudes of the speeds during first two seconds and next four seconds. ( )

A) 1:1
B) 2:1
C) 1:2
D) 3:2
Answer:
B) 2:1
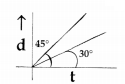
Question 2.
The displacement-time graphs of two moving particles make angle of 30° and 45° with X-axis. The ratio of the two velocities is ( )
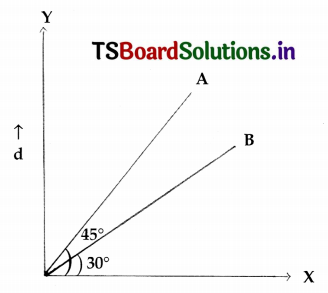
A) \(\sqrt{3} \) : 1
B) 1 : 1
C) 1 : 2
D) 1: \(\sqrt{3} \)
Answer:
D) 1: \(\sqrt{3} \)
Question 3.
The graph of displacement time for two bodies in straight line are given. The ratio of velocities is ………. ( )
A) 3 : 1
B) 1 : 3
C) \(\sqrt{3} \) :1
D) 1 : \(\sqrt{3} \)
Answer:
B) 1 : 3
Question 4.
Pick up the correct answer for the displacement-time graphs. ()
A) Graph A and B shows that the body is traveling with uniform velocity.
B) Graph A shows that the body travels with uniform velocity starting from rest, graph B shows that the body travels with some initial velocity.
C) Graph A shows that the body travels with uniform velocity starting with some initial velocity. Graph B shows that the body is travelling with uniform velocity starting from rest.
D) Graph A and B shows that the body is at rest.
Answer:
C) Graph A shows that the body travels with uniform velocity starting with some initial velocity. Graph B shows that the body is travelling with uniform velocity starting from rest.
Question 5.
From the graph, what does AB and BC represent?
A) AB represents the body is at rest. BC respresents the body is moving with uniform velocity.
B) AB represents the body is moving with uniform velocity. BC represents the body is at rest.
C) AB and BC are same
D) AB represents the body is accelerating. BC is represents the body is at rest.
Answer:
B) AB represents the body is moving with uniform velocity. BC represents the body is at rest.
Question 6.
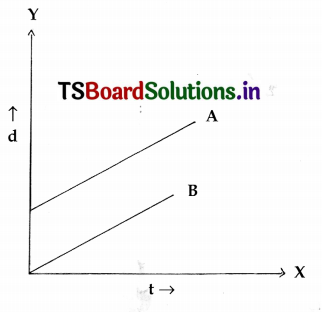
The position-time (x – t) graphs for two children A and B returing from their School “O” to their Homes ‘P and ‘Q’ respectively are as shown in the figure. Choose the incorrect statement regarding these graphs. ( )
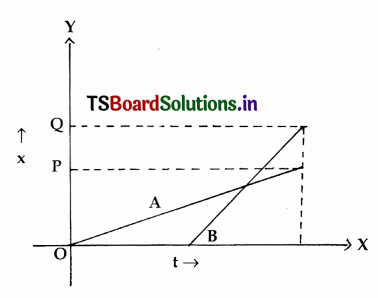
A) ‘A’ lives closer to the school than ‘B’.
B) A starts from the school earlier than ‘B’.
C) A walks faster.
D) A and B reach home in same time.
Answer:
C) A walks faster.
Question 7.
The acceleration of moving body can be found from. ( )
A) Area under velocity -time graph.
B) Area under the displacement-time graph.
C) Slope of the velocity-time graph.
D) Slope of the distance-time graph.
Answer:
A) Area under velocity -time graph.
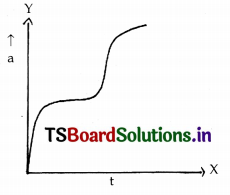
Question 8.
The displacement of a particle as a function of time is shown in figure. Choose the correct answer. ( )
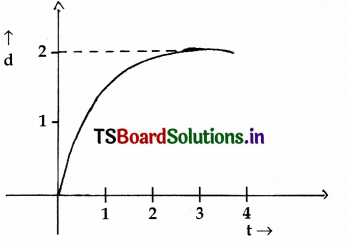
A) The particle starts with certain velocity hut the motion is retarded and finally the particle stops.
B) The velocity of the particle is constant throughout.
C) The acceleration of the particle is constant throughout.
D) The particle starts with constant velocity then motion is accelerated and finally the particle moves with another constant velocity.
Answer:
A) The particle starts with certain velocity hut the motion is retarded and finally the particle stops.
Question 9.
Which of the following option is correct for having a straight line motion represented by “t — d” graph? ( )

A) The object moves with constantly increasing velocity from 0 to ‘A’ then it moves with constant velocity.
B) Velocity of the object increases uniformly.
C) Average velocity is zero.
D) The graph shown is impossible.
Answer:
C) Average velocity is zero.
Question 10.
The displacement-time graph of moving particle is shown below. The Instantaneous velocity of the particle is negative at the point. ( )
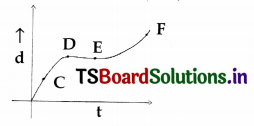
A)D
B) F
C) C
D)E
Answer:
C) C
Question 11.
For the displacement-time graph shown in figure the ratio of magnitudes of the speeds during the first two seconds and the next four second is ……………. .( )
A) 1:1
B) 2:1
C) 1:2
D) 3:2
Answer:
B) 2:1
Question 12.
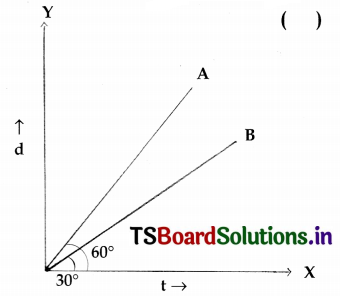
The displacement time graphs of two moving particles makes angle of 30° and 45° with the X-axis. The ratio of two velocities. ( )
A) \(\sqrt{3} \) : 1
B) 1 : 1
C) 1 : 2
D) 1 : \(\sqrt{3} \)
Answer:
D) 1 : \(\sqrt{3} \)
Question 13.
An elevator is going up. The variation in the velocity of the elevator is as given in the graph. What is the height to which the elevator takes the passengers? ( )
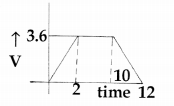
A) 3.6m
B) 28.8m
C) 36.0 m
D) 72.0 m
Answer:
C) 36.0 m
Question 14.
Assertion: The position-time graph of a body may be a straight line parallel to time axis. ( )
Reason: It is possible that position of a body does not change with time.
A) Both (A) and (R) are true and (R) is the correct explanation of (A)
B) Both (A) and (R) are true and (R) is not the correct explanation of (A)
C) (A) is true but (R) is false.
D) (A) is false but (R) is true.
Answer:
D) (A) is false but (R) is true.
Question 15.
Assertion: Displacement of a body may he zero when distance travelled is not zero.
Reason: The displacement is the longest distance between initial and final positions. ( )
A) Both (A) and (R) are true and (R) is the correct explanation of (A)
B) Both (A) and (R) are true and (R) is not the correct explanation of (A)
C) (A) is true but (R) is false.
D) (A) is false but (R) is true.
Answer:
C) (A) is true but (R) is false.