The strategic use of AP Inter 1st Year Economics Model Papers and AP Inter 1st Year Economics Question Paper May 2015 allows students to focus on weaker areas for improvement.
AP Inter 1st Year Economics Question Paper May 2015
Note : Read the following instructions carefully :
- Answer ALL the questions as per the choice specified. Draw suitable diagrams wherever necessary.
- Questions from Serial Nos. 1 to 5 in Section ‘A’ are of Long Answer Type. Each question carries TEN marks. ANY THREE questions j may be answered out of five given questions. Every answer may he limited to 40 lines.
- Questions from Serial Nos. 6 to 17 in Section ‘B’ are of Short Answer Type. Each question carries FIVE marks. ANY EIGHT questions may be answered out of twelve given questions. Every answer may be limited to 20 fines.
- Questions from Serial Nos. 18 to 37 in Section ‘C’ are of Very Short Answer Type. Each question carries TWO marks. ANY FIFTEEN questions may be answered out of twenty given questions. Every answer may be limited to 5 fines.
Section – A
Note : Answer ANY THREE out of the following five questions. (3 × 10 = 30)
Question 1.
Explain the law of Diminishing Marginal Utility and its limitations.
Answer:
H.H. Gossen was the first economist to explain the law of diminishing marginal utility in 1854. This is also known as “Gossen’s : first law”. In 1890 Marshall in his “Principles of economics” developed and popularised this analysis. This law is based on the common experience of every consumer.
This law explains the functional relationship between the stock of a commodity and the marginal utility of that commodity. If a consumer goes on increasing his stock of a thing, additional utility derived from an additional unit declines.
Alfred Marshall’ defines the “Law of diminishing marginal utility” as “The additional benefit which a person derives from a given increase of his stock of a thing diminishes with every increase in the stock that he already has”.
Total Marginal Utility:
The want satisfying capacity of a thing is called utility. It can be explained as total utility and marginal ‘ utility. Total utility is the sum of the marginal utilities. Total utility 1 tends to be more with larger stock and less with smaller stock. TUn = f(Qn)
Marginal utility is the additional utility obtained from an additional unit of any commodify consumed.
MUn = TUn – TUn-1
Explanation of the law:
The law of diminishing marginal utility explains the relation between the quantify of good and its marginal utiltiy. If a person goes on increasing his stock of a thing the marginal utility derived from an additional unit declines. The law is claer from the following table.
Total Utility and MarginalUtility Schedule:
| No. of Apples | Total Utility (Utils) | Maarginal Utility (Utils) |
| 1 | 20 | 20 |
| 2 | 35 | 15 |
| 3 | 45 | 10 |
| 4 | 50 | 5 |
| 5 | 50 | 0 |
| 6 | 45 | -5 |
| 7 | 35 | -10 |
In the above table total utility increasing at a diminishing rate till 5th apple and becomes maximum. Marginal utility declining positively till 4th apple and become zero at the 5th apple. From the 6th and 7th apples total utility declines positively and marginal utility becomes negative. Zero marginal utility implies the point of satiety which indicates the complete satisfaction of a given want.
Relation between total utility and marginal utility:
- When total utility increases at a diminishing rate, marginal utility diminishes.
- When total utility is maximum, marginal utility becomes zero.
- When total utility decreases positively, marginal utility becomes negative.
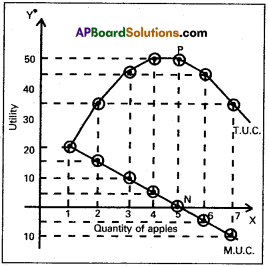
The law of diminishing marginal utility can also be represented diagramatically with the help of the marginal and total utility curves. In the diagram the horizontal axis shows the units of the commodity and vertical axis measures the utility obtained from the units. The T.U.C. represents total utility and M.U.C. represent marginal utility curves.
The T.U.C. curve slopes up-wards from left to right upto point ‘P’ and then slopes down¬ward from left to right. The M.U.C. slopes downwards from left to right. It cuts the X – axis at point ‘N’ when total utility at its maximum. It means the marginal utility is equal to zero, when total utility is at its maximum.
If the consumer consumes apples further, the totalutility curveT.U.C. falls from point ‘P’ and slopes downwards from left to right. Therefore M.U.C. is below X-axis after ‘N’ point. It means the marginal utility is negative.
Limitations of the law: There are certain limitations to the law.
- One of the important assumptions of the law is that consumer’s tastes and preferences remains constant. If there is any change in consumer’s habits and preferences this law does not hold good.
- This law is not applicable for durable goods, as we can use these commodities for a longer time and measurement of utility is not possible. :
- In case of complementary goods where we need two or more goods to satisfy a single want this law does not apply.
- If it is not possible to divide the commodity into small units, we can not measure the utility of successive units. So this law is not applicable for indivisible goods.
- Hobbies like stamps and coin collection are an exception to the law of diminishing marginal utility, as the additional units give more satisfaction to the consumer.
![]() .
.
Question 2.
Explain the law of returns to scale.
Answer:
The study of changes in output as a consequence of changes in the scale of firms is the subject matter of “Returns to Scale”. So, the law of returns to scale describes the relationship between output and the scale of inputs in the long – run. In the long – run, adjustments can be made among the different factors and therefore, all factors become variable during this period. It means, in the long – run the size of the firm can be changed by changing the scale Of production. Returns to scale are of three types. They are:
- Increasing returns to scale.
- Constant returns to scale.
- Diminishing returns to scale.
1. Increasing returns to scale:
Increasing returns to scale means that output increases in a greater proportions than the increase in inputs. When a firm expands increasing returns to scale are obtained in the beginning. There are three reasons for increasing returns to scale. They are: a) Indivisibility, b) Dimensional economies and c) Specialisation.
a) Indivisibility:
Increasing returns to scale arise due to the indivisibilties of some factors of production. Indivisibilities are associated not only with the plant and machinery but also with labour, management, marketing etc. In general indivisibility means that equipment is available only in minimum size or in definite ranges of sizes. Therefore, when a business firm expands its scale of production, the indivisible factors are employed to their maximum capacity. For instant, one-half of the driver cannot be employed just because the truck is a small one.
b) Dimensional Economies:
Dimensional economies take place when the size of a capital good like machine enlarged to increase production. Thus economies will be obtained as the size increases. For instant, if the diameter of a water pipe is doubled, the flow through it is more than doubled. Similarly a 1′ × 1′ × 1′ box requires a certain quantity of wood. The 3′ × 3′ × 3′ box just requires ‘nine times more wood. But it hold 27 times more material. But this kind of economies cannot be obtained indefinitely.
c) Specialisation:
According to Prof. Chamberlin returns to scale increase because of greater possibilities of specialisation of land and machinery. When the scale of the firm is explained there is wide scope for the specialisation of labour and equipment. Thus with specialisation efficiency increases and increasing returns to scale follow.
Further it enjoys internal and external economies of production. Consequently there is reduction in the per unit cost of production. The range of increasing returns to scale depends upon the nature of the industry concerned. And there are limits to the operation of increasing returns.
Question 2.
Constant returns to scale:
It is natural for the constant returns to scale appear after increasing returns and enjoyed for sometime. As the firm is enlarged further, at a stage internal and external economies are counter balanced by internal and external diseconomies. In this stage the proportionate change in the output will be equal to the proportionate change in the inputs. This stage bf constant returns to scale is very short.
Question 3.
Diminishing returns to scale:
When a firm goes on expanding its size or scale beyond a point diminishing returns will occur. In this stage the proportionate change in the output is less than proportionate change in the inputs. In this stage the advantages of large scale production are swapped by the disadvantages of large scale production. Indivisible factors may become inefficient and large management creates difficulties of control, supervision, coordination etc. So, the diminishing returns to scale come into operation. This stage is actually a special case of law of variable proportions. Because the fixed factor of entrepreneur is combined with all other variable factors in the production process. The law of returns to scale’can also be explained with the help of the following diagram.
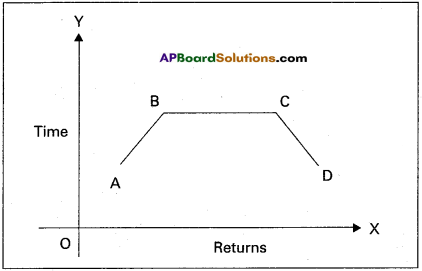
Returns is shown on X-axis, time period is shown on Y-axis. A to B indicates increasing returns stage, B to C indicates diminishing returns stage.
![]() .
.
Question 3.
What is Market? Explain the classification of markets.
Answer:
Market is commonly thought of as a place where commodities are bought and sold and where buyers and sellers meet. But in economics, the word market does not refer to any particular place. It refers to a region. “Market implies the whole area over which buyers and sellers are in such touch with each other, direction or through middlemen, that the price of the commodity in one part influences it in other parts of it”.
According to Benham’s: Market means “any area over which buyers and seller are in such close touch with one another, either directly or through dealers, that the prices obtainable in one part of the market affect the price period in other parts”. According to ‘Mac millari – market means “generally any context in which sale and purchase of goods and services takes place. There need be no physical entity corresponding to a market. It may, for example, consist of network at telecommunications across the world on which, say Shares are traded”.
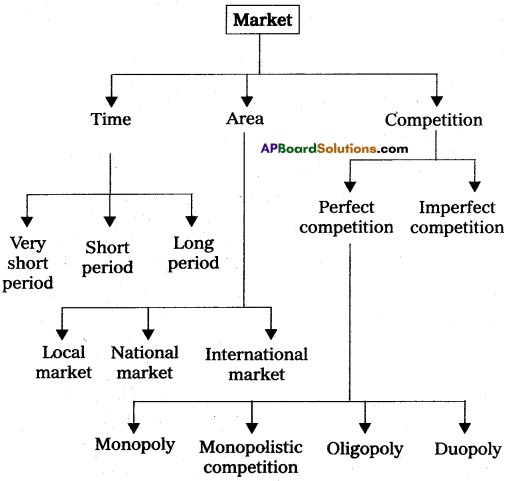
Classification of markets:
Markets can be classified on the basis of 1) area covered 2) time and 3) degree of competition.
1) On the basis of area
2) On the basis of time
3) On the basis of competition.
I. On the basis of area : According to the area, markets can be of three types.
- Local market: When a commodity is sold at particular locality. It is called a local market. Ex : Vegetables, flowers, fruits etc.
- National market: When a commodity is demanded and supplied throughout the country is called national market. Ex : Wheats rice etc.
- International market : Wien a commodity is demanded and supplied all over the world is called international market. Ex : Gold, silver etc.
II. On the basis of time : It can be further classified into three types.
- Market period or very short period:
In this period where producer cannot make any changes in supply of a commodity. Here supply remains constant. Ex : Perishable goods. - Short period:
In this period supply can be change to some extent by changing the variable factors of production. - Long period:
In this period supply can be adjusted in according change in demand. In long run all factors will become variable.
III. On the basis of competition: This can be classified into two types.
- Perfect market:
A perfect market is one in which the number of buyers and sellers is very large, all engaged in buying and selling a homogeneous products without any restrictions. - Imperfect market:
In this market, competition is imperfect ‘ among the buyers and sellers. These markets are divided into- Monopoly
- Duopoly
- Oligopoly
- Mono polistic competition.
Question 4.
What is National Income? Explain the various methods of calculating National Income.
Answer:
The concept of National Income did not receive much attention from the economists until the great economic depression of thirties. National Income is determined by the volume of employ¬ment. J.M. Keynes brought out the importance of National Income and employment in economic theory to achieve rapid economic development The study of National Income is important.
“National Income or National dividend is the flow of goods and services produced and made available to the people in a country ‘ in a year”.
National Income may be interpreted in three ways : 1) The total value of output in a country in a year, 2) The total value of all incomes received by the owners of factors of production in a year, 3) The total expenditure incurred on all goods and services in a year.
According to ’Marshall’ – “The labour and capital of a country, , acting upon its natural resources produce annually a certain net aggregate of commodities, material and immaterial including services of all kinds.
Methods of measuring National Income: There are three methods of measuringNationai Income. They are:
1) Net output method or value added method,
2) Income method and 3) Expenditure method.
1) Product Method or Output Method:
GNP is total value of final goods and services produced in a year. The final goods are valued at market prices, whether sold or added on inventories. Gross National Product (GNP) is always stated in money term. No item should be counted twice. To avoid double counting we exclude raw – materials and intermediate goods. For example: we include the value of bread only but not include the value of flour which used to make bread.
2) Income Received or Income Method: We added the income received by individuals and other for the services rendered by them in production. The total incomes of the factors of production put together is the National Income. The following precautions are to be taken, in estimating National Income :
- Exclude all transfer payments like old age pensions, interests etc.
- Exclude all illegal incomes and wind fall gains.
- Value of production for self-consumption and imputed rent of owner occupied houses.
- Incomes divided from the sale of second hand goods shall not be included.
- We should not count any income twice. For example, the profits distributed by companies will be included in incomes of the shareholders. So it shall not be included in the incomes of companies.
3) Expenditure Method:
This process of adding up expen-diture on all final goods is called the expenditure approach. The Gross National Product is divided into four component parts according to who buys the goods and services,
- Goods and services bought by consumers;
- Investment goods purchased by business houses;
- A combination of consumer and investment goods purchased by government and
- Net exports (Value of exports minus value of imports) to foreign countries. It is the aggregate value of current production of goods and services flowing to the consumer business houses, government and foreign countries.
Question 5.
Explain the Keynesian theory of employment.
Answer:
The logical starting point of Keynes theory of employment is the principle of effective demand. In a capitalist economy the level of employment depends on effective demand. Keynes used term effective demand to denote the total demand for goods and services at various levels of employment. In ordinary language demand means desire. It becomes effective when income is spent in buying. Consumption goods and investment goods. Different levels of employment represent different levels of aggregated demand.
But there can be a level of employment where aggregate demand . equals aggregate supply. In the words of Keynes, “the value of aggregate demand at a point of aggregate demand function, where it is intersected by the aggregate supply function will be called the effective demand”. This effective demand will determine the level of employment. We start with analysing aggre-gate supply and aggregate demand.
Aggregate supply schedule:
How much output the firms will produce depends upon the aggregate expectation held by them with regard to the scale proceeds which they must expect to receive from-scale of the output. This brings us to the concept of aggregate supply schedule. The aggregate supply schedule shows the various amounts of the commodity that will be offered for sale at a series of prices. Increased output is associated with the increased cost.
The aggregate supply curve must therefore slope upwards from left to right. In the figure given below the aggregate supply curve is represented by the line ‘AS’ which bisects the origin at 45°. But when the economy reaches the level of full employment, the aggregate supply curve becomes vertical. Even with the increase in the aggregate supply price, it is not possible to provide more employment as economy has attained the level of full employment.
Aggregate demand schedule:
The aggregate demand price for a given output is the amount of money proceeds which the firm expect to receive from the sale of that output. It is equal to total ( revenue. A statement showing the various aggregate demand prices at different levels of employment is called the aggregate demand price schedule or aggregate demand function. The table reveals that the longer the output, (level of employment) the greater must be the total revenue and vice-versa.
Equilibrium level of income:
Determination of effective demand. The aggregate demand and supply schedules takes up to the heart of Keynes income and employment theory. The two determinants of effective’ demand namely aggregate supply and aggregate demand prices combined schedule is here under.
Effective demand schedule
| Level of employment (In thousands) | Aggregate demand price (Rs. lakhs) | Aggregate supply price (Rs. lakhs) |
| 20 | 200 | 175 |
| 30 | 250 | 225 |
| 40 | 300 | 300 |
| 50 | 350 | 325 |
| 60 | 400 | 425 |
The table shows that so long as the demand price is higher than the aggregate supply price, it is profitable for entrepreneurs to employ more workers. But when the proceeds necessary and proceeds expected equal to Rs. 300 lakhs, the level of employment rises to 40 thousand. This point of equality between aggregate demand function and aggregate supply function is called effective demand. It is that aggregate demand price which becomes effective because it is equal to aggregate supply price. Thus, it represents a position of short – run equilibrium.
The way in which effec-tive demand determines the level of income and employment is shown in the following diagram. In the diagram, X – axis represents the employ-ment, Y – axis represents aggregate demand price and aggregate supply price. AS is the aggregate supply curve. AD is the aggregate demand curve.
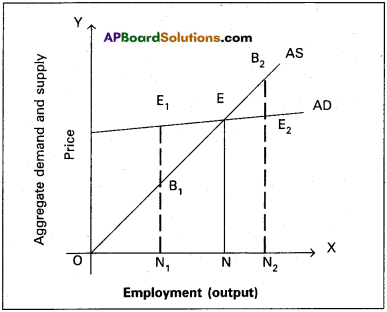
The point of intersection between the two ‘E’. This is effective demand where all workers are employed. As this point, the entre¬preneurs expectations of profits are maximised. At any other points, the entrepreneurs will either incur losses or earn sub – normal profits. Effective demand is equal to the total expenditure of the community. Then the components of effective demand are, Y = C + I + G + (X – M).
Section – B
Note : Answer ANY THREE out of the following five twelve question (8 × 5 = 40)
Question 6.
Explain Jacob Viner’s definition.
Answer:
Jacob Vine?s definition of economics is considered as modem definition of economics. He is an American economist known for his short run and long run cost curve analysis. According to Jacob Vinef Economics is what economists do”.
The problem of the economy are.
- What to produce and in what quantities: The economy has to decide whether to produce consumer goods and capital goods. These decisions are influence by individuals as well as government.
- How to produce these godds: A decision has to be made whether to use labour intensive or capital intensive techniques.
- For whom to produce these goods and services: It is concernned with the distribution of income and wealth among different sections of the society.
- How efficient the productive resources are in use: This refers to the efficiency of economic system.
- Whether the available resources are fully utilised : If resources are fully utilised that it can provide more employment opportunities.
- Is the economy growing or static over a period of time.
Question 7.
What is Utility? Explain the various types of utility.
Answer:
The want satisfying capacity of a commodity at a point of time is known as utility. Types of utility:
- Form utility:
Form utilities are created by changing the shape, size and colour etc. of a commodity so as to increase its want satisfying power. Ex : Conversion of a wooden log into a chair. - Place utility:
By changing the place some goods acquire utility. Ex: Sand on the sea shore has no utility. If it is brought out and ransported to market, it gains utility. This is place utility. - Time utility:
Time utilities are created by storage facility. Ex : Business men store food grains in the stock points in the off season and releases them to markets to meet high demand and obtained super normal profits. - Service utility:
Services also have the capacity to satisfy human wants. Ex : Services of Lawyer, Teacher, Doctor etc. These services directly satisfy human wants. Hence they are called as service utilities.
![]() .
.
Question 8.
Explain Indifference Map.
Answer:
All desires of a consumer are not equally important and urgent. Because of the limited income at his disposal the consumer is forced to select the more important and urgent want. Indifference curve shows the various combinations of two commodities which yield equal utility or satisfaction to the consumer.
Indifference Map : A set of indifference curves drawn for different income levels is called indifference map.
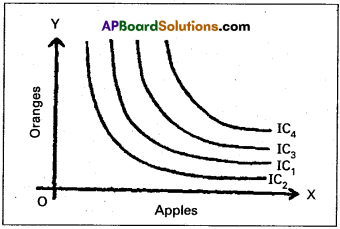
By the diagram apples are shown on x-axis, oranges are shown on y-axis. Higher IC gives higher level of satisfaction, lower IC gives lower level of satisfaction to the consumer.
Question 9.
Explain the factors that determine demand.
Answer:
Demand function states the factors that determine the demand for a good. The following are the important factors :
1) Price of the good:
There is an inverse relationship between the quantity demanded and the price of the commodity. That is
when the price falls, the demand for the good increases and the demand for the good decreases with a rise in the price of the good.
2) Consumer’s Income:
It is obvious that income will influence the amount of most goods and services people will purchase at any given price. In case of ‘normal’ goods the quantity demanded increases with rise in income. But in the case of ‘inferior’ goods the quantity demanded at any price will fall with an increase in income. The idea is that the consumer generally goes in favour of better goods as soon as they can afford to.
3) Prices of substitutes and complementaries:
In case of substitutes there exists a direct or positive relationship between the price and quantity demanded. For example, goods like tea and coffee an increase in the price of one will tend to increase the demand for the other. In case of complementary goods there exists an inverse or negative relationship between the price and quantity demanded. For example, goods like car and petrol, the fall in price of cars will lead to an increase in the demand for petrol.
4) Changes in Tastes:
Not all people share the same tastes. Nor does taste always remain fixed over time. This includes changes in fashions, customs, habits etc. If the consumer acquires a taste for a particular commodity, its demand is bound increase. For instance, the demand for a particular brand of soap increases due to the use of the same in an advertisement involving a famous film actor or actress.
Question 10.
Explain the various types of Price Elasticity of Demand.
Answer:
Price elasticity of demand relates to the responsiveness of quantity of commodity demanded to the change in its price.
Ep = \(\frac{Proportionate change in demand}{\sqrt{Proportionate change in price}}\)
Types of Price elasticity of demand: Based on the numeri¬cal value, price elasticity of demand can be
- Perfectly elastic demand (Ed = oo)
- Relatively elastic demand (Ep > 1)
- Relatively inelastic demand (Ep < 1)
- Unitary elastic demand (Ep = 1)
- Perfectly inelastic demand (Ep = 0)
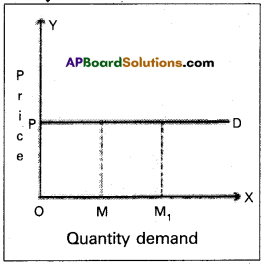
1) Perfectly elastic demand:
It is a negligible change in price leads to an infinitive change in demand in said to be perfectly elastic demand. In this case the demand curve is a horizontal straight line to ‘x’ axis.
Ep = \(\frac{\mathrm{MM}_1}{\mathrm{OM}} \div \frac{\mathrm{O}}{\mathrm{OP}}\)
= \(\frac{\mathrm{MM}_1}{\mathrm{OM}} \times \frac{\mathrm{OP}}{\mathrm{O}}=\alpha\)
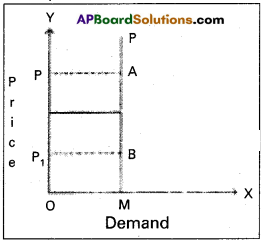
2) Perfectly inelastic demand:
If there is a any change in price does not lead any change in quantity demand is known as perfectly inelastic demand.
Ep = \(\frac{\mathrm{MM}_1}{\mathrm{Om}} \div \frac{\Delta \mathrm{p}}{\mathrm{p}}\)
Ep = \(\frac{\text { zero }}{\text { OM }} \div \frac{\Delta \mathrm{p}\left(\mathrm{pp}_1\right)}{\mathrm{OP}}\)
∴ Ep = 0
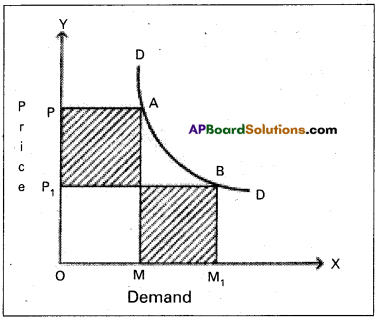
3) Unitary elastic demand:
If the proportinate change price leads to the same proportionate change in quantity demand is called unitary elastic demand. In this the Ed = 1. The demand curve is rectangular hyperbola Here OP1 = BM1
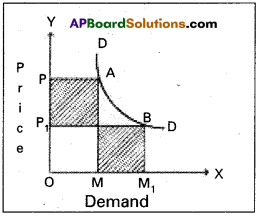
4) Relatively elastic demand:
When a proportionate change in price leads to a more than pro-portionate change in demand is called relatively elastic demand In this case Ed = > 1. The diagram shows small change in price PP1 resulted in a great change in demand (MM1)
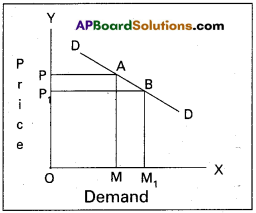
∴ OP1BM1 = OPAM.
5) Relatively inelastic demand:
When a proportianate change in price leads to a less than proportionate change in demand is called
relatively inelastic demand. In this case Ed is < 1.
In the diagram BM1 < OPAM
∴ Ep < 1.
Question 11.
Explain Ricardian theory of Rent/
Answer:
Rent isrthe reward or payment to land service. In the ordinary sense, the term ‘rent’ denotes a payment made towards hire charge for any durable good, e.g., house rent, cycle rent etc. In economic theory, various concepts of rent are distinguished. They are :
1) Contract rent:
Contract rent is a periodical payment for the use of durable commodities. In other words. ‘The actual amount paid by the tenant to the landlord is called contract rent. Contract rent includes economic rent.
2) Economic rent:
It is the payment made by the tenant to the landlord for the use of his land and land alone. Economic rent accrues only to the landlord for the use of his land by the tenant. Economic rent is surplus over cost.
According to ‘Senior1:
“Rent is the surplus produce arising from the use of an appropriated natural agent”.
According to ‘Marshall’: Rent is “the income derived from the free gifts of nature, when the term is being considered in relation to the society at large”.
Ricardian theory of rent:
David Ricardo was a 19th century economist of England, who propounded a systematic theory of rent, kicardo defined rent as “that portion of the produce of earth which is paid to the landlords for the use of the original and indestructible powers of soil”. According to Ricardo, rent arises due to differential in surplus accuring to agriculturists resulting from the differences in fertility of soil of different grades of land. This was contrary to the opinion of French economists, known as “Physiocrats’ who considered rent as the result of bounty of nature.
Ricardian theory of rent is based on the principle of demand and supply. It arises in both extensive
and intensive cultivation of land. When land is cultivated extensively, rent on superior land equals the excess of its produce over that of the inferior land. This can be explained With the following illustration.
We can imagine that a new island is discovered. Assume a batch of settlers go to that Island. Land in this Island is differ in fertility and situation. We assume that there are three grades of land A, B and C. With a given application of labour and capital superior lands will yield more output than others. The difference in fertility will bring about differences in the cost of production, on the different grades of land.
They first settle on A’ grade land for cultivation of corn. A’ grade land yields say 20 quintals of com with the investment of ? 300. The cost of production per quintal is ? 15 (300/20). The price of com in the market has to cover the cost of cultivation. Otherwise the farmer will not produce com. Thus the price in the present case should be at least ? 15 per quintal. As time passes, population increases and demand for land also increases.
In such a case people have to cultivate next best land, i.e., ‘B1 grade land. The same amount of ? 300 is spent of ‘B’ grade land gives only 15 quintals of com as ‘B’ grade land is less fertile. The cost of cultivation on ’B’ grade land risen to ₹20 (300/15) per quintal of com. If the price of com per quintal in the market is then ? 20, the cultivator of ‘B’ grade and will be not cultivated. Therefore the price has to be high enough to cover the cost of cultivation on B’ grade land. Hence the price also rises to ₹20. There is no surplus on ‘B’ grade land. But on A grade land, the surplus is 5 quintals or ₹100 (5 × 20).
Further, due to growth of population demand for land and com increased. This necessitates, the cultivation of ‘C’ grade land with ? 300 investment cost. It yields only 10 quintals of corn. Therefore the per quintal production cost rises to 30 (300/10). Then the price per quintal must be at least ? 30 to cover the cost of production. Otherwise ‘C’ grade land will be withdrawn from cultivation. At price ₹ 30.
‘C’ grade land yield no surplus or rent. But A grade land yields still layer surplus of 10 quintals or ₹300 (10 x 30). But surplus or rent on ‘B’ grade land has 5 quintals or ₹150 (5 × 30). But there is no surplus or rent on ‘C’ grade land. It covers just the cost of cultivation. Hence, ‘C’ grade land is a marginal land which earns no rent or surplus.
This can also be explained with the following table.
| Types of land | Cost of Production | Produce (Quintals) | Price | Total Revenue | Rent or surplus | |
| In physical units | In value form (₹) | |||||
| A | 300 | 20 | 15 | 300 400 600 |
–
5 10 |
–
100 300 |
| B | 300 | 15 | 20 | 300
450 |
–
5 |
–
150 |
| C | 300 | 10 | 30 | 300 | – | – |
The essence of Ricardian theory of rent.
- Rent is a pure surplus.
- Rent is differential surplus.
- Rent does not deter-mine or enter into price.
- Diminishing returns applies to agricultural production.
- Land is put to only one use i.e., for cultivation.
Ricardian theory of rent can be explained with the help of diagram
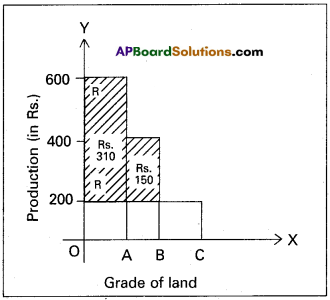
In the above diagram the shaded area represents the rent or differential surplus. The least fertile land i.e., C does not carry any rent. So it is called marginal land or no rent land.
Question 12.
What are the factors that determine National Income?
Answer:
The concept of National Income occupies an important place in economic theory. National Income is the flow of goods and services which become available to a nation during a year. Factor determining National Income : There are a number of influences which determine the size of the National Income in a country.
1) Quantity and quality of factors of production : The quantity and quality of land, climate, rainfall etc., determining the quality and quantity of agricultural output in any country. Hence it determines the size of National Income. The quantity of labour increases the productivity of the nation. Mineral resources can raise the industrial production. The qualitative and quantitative capital stock has the greatest influence on total output. National Income depends on physical capital and human capital also.
2) The state of technology:
A country with a poor technical knowledge cannot have a large sized national output or dividend. Because it will not be in a position to make the best possible use of its resources.
3) Entrepreneurial ability:
The quality and quantity of entrepreneurial ability is also an important element to determine the size of National Income of a country. The availability of resources along with efficient allocation of them determines the level of National Income.
4) Political stability:
Political stability is an essential pre-requisite for maintaining production at the highest level. The economic development of several countries, particularly the South American Republics has been hindered in the past by political instability.
5) Non-economic factors: Nort-economic factors will also determine the size of National Income. Social and cultural factors of the nation will influence the size of National Income of a country.
6) Other factors:
Development of banking, government policies, level of education, development of transportation and communication facilities will also contribute to the National Income.
![]() .
.
Question 13.
Describe any five methods of redemption of Public debt.
Answer:
Redemption of public debt means repayment of public debt. All government debts should be rapid promptly. There are various methods of repayment which may be discussed under the following heads.
1) Surplus budget:
Surplus budget means having public revenue in excess of public expenditure. If the government plans for a surplus budget, the excess revenue may be utilized to repay public debt.
2) Refunding:
Refunding implies the issue of fresh bands and securities by government so that the matured loans can be used for repayment of public debt.
3) Annuities:
By this method, the government repays past of the public debt every year. Such annual payments are made regularly till the debt is completely cleared.
4) Sinking fund:
By this method, the government creates a separate fund called ‘Sinking fund’ for the purpose of repaying public debt. This is considered as the best method of redemption.
5) Conversion:
Conversion means that the existing loans are changed into new loans before the date of their maturity.
6) Additional taxation:
Government may resort to additional taxation so as to raise necessary funds to repay public debt under this method new taxes are imposed.
7) Capital levy:
Capital levy is a heavy one time tax on the capital assets and estates.
8) Surplus Balance of payments:
This is useful to repay external debt for which foreign exchange is required surplus „ balance of payment implies exports in excess of imports by which reserves of foreign exchange can be created.
Question 14.
Explain the sources of public revenue.
Answer:
Public revenue is an important concept in public finance. It referes to the income of the government from different sources. Dalton in his “Principles of Public Finance” mentioned two kinds of public revenue. Public revenue includes income from taxes, prices of goods and services of public enterprises, revenue from administrative activities such as fees, fines etc., and gifts and grants.
Sources of Public Revenue : Broadly speaking, government receives revenue it from five different sources namely :
- Taxes
- Commercial
- Administrative revenue
- Grants
- Gifts.
These different sources of public revenue may be explained as follows :
1) Taxes:
Taxes are the first and foremost source of public revenue. Taxes are compulsory payments to government without expecting direct benefit or return by the tax payer.
2) Commercial Revenue:
Commercial revenue imply the incomes received by government from public enterprise by selling their goods and services. They are obtained by the government in the form of price of goods and services. Income from electricity, auction of liquor sale, railway services, oil, sterl, mines, forests etc.
3) Administrative Revenue:
These includes fees, licences, fires, forfeitures and special assessments. They are collected from those individuals who get benefits. As these arises due to the efforts of administrative personnel, they are described as administrative revenue.
4) Grants:
Grants are received by a country from other countries. The local and provincial governments with in a country receive grants-in-aid from Central Government for performing certain functions. The Central Government gives gram – in – aid on conditional or unconditional basis. The grants received by the government of a country from the governments of other countries are known as foreign aid. Especially grants are highly useful for the underdeveloped countries is achieving economic development.
5) Gifts:
Gifts comprise the cost important source of public revenue. They refer to the voluntary contribution from individuals or institutions to the government at different levels. Individuals denote liberally in times of war, famine, cyclone etc.
Question 15.
Examine the difficulties of the Barter system.
Answer:
Barter system means exchange of goods. This system was followed in old days. But the population and its requirements are increasing, the system became very complicated. The difficulties of barter system are:
1) Lack of coincidence of wants:
Under the barter system, the buyer must be willing to accept the commodity which the seller is willing to offer in exchange. The wants of both the buyer and the seller just coincide. This is called double coincidence of wants. Suppose the seller has a good and he is willing a exchange it for rice. Then the buyer must have rice and he must be willing to exchange rice for goat. If there is no such coincidence direct exchange between the buyer and the seller is not possible.
2) Lack of store value:
Some commodities and perishables. They perish with in a short time. It is not possible to store the value of such commodities in their original form under the barter system. They should be exchanged before they actually perish.
3) Lack of divisibility of comm’odities:
Depending upon its quantity and value, it may become necessary to divide a commodity into small units and exchange one or more units for other commodity. But all commodities are not divisible.
4) Lack of common measure of value:
Under the barter system, there was no common measure value. To make exchange possible, it was necessary to determine the value of every commodity interms every other commodity.
5) Difficulty is making deferred payments:
Under barter system future payments for present transaction, was not possible, because future exchange involved some difficulties. For example suppose it is agreed to sell specific quantity of rice in exchange for a goat on a future date keeping in view the recent value of the goat. But the value of goat may decrease or increase by that date.
![]() .
.
Question 16.
Enumerate the measures for control of Inflation.
Answer:
To control the inflation the Government has taken various steps. They are :
- Increase the production in the long-run.
- Implementing proper monetary and fiscal policies to reduce the supply of money and credit.
- Controlling prices and eliminating black markets.
- Importing the goods which are scares in supply from outside countries.
- Introducing rationing and quota system in case of mass consumption of goods.
- Distribution of goods to all the needy sections of the ‘ people.
Question 17.
Explain the relationship between Economics and Statistics.
Answer:
There is close relationship between statistics and economics. In the words of Tugwell “The science of economics is becoming statistical in its; method”. All the economic laws are pronounced on the basis of statistical facts and figufes. The theory of population of Malthus, law of family expenditure of engels etc., were propounded after statistical tests. Statistics helps the economics to become an exact science.
In the study of theoretical economics, the application and use of statistical methods are of great importance. Most of the doctrines of economics are based on the study of a large number of units and their analysis. This is done through statistical methods. Law of demand was formulated because of statistical methods.
The importance statistics is felt in all branches of knowledge in accountancy and auditing in banking, in insurance in research and many fields. Without statistics no branch of knowledge is complete.
Section – C
Note : Answer ANY EIGHT out of the following twelve question (15 × 2 = 30)
Question 18.
Capital Goods.
Answer:
Goods which are used in the production of other goods are called producer or capital goods. They satisfy human wants in directly. Ex : Machines, tools, buildings etc.
Question 19.
Price.
Answer:
The price of anything is its value measured in terms of money i.e. the value of a commodity expressed in terms of money. For Ex : a commodity is exchanged for 50 rupees then the price of commodity is 50 rupees.
Question 20.
Cardinal Utility.
Answer:
Alfred Marshall developed cardinal utility analysis. According to this analysis the utilities derived from consumption of different commodities can be measured in terms of arbitary units called utils. ‘Cardinal numbers’ and also can compare the utilities of different commodities.
Question 21.
Substitutes.
The goods which satisfy the same want are called substitutes. Ex : Tea and coffee; pepsi and coca-cola etc. In the case of substitutes, the demand curve has a positive slope.
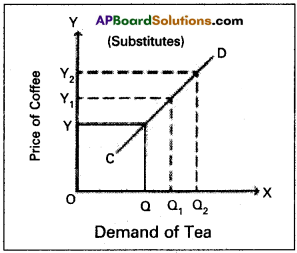
In the diagram ‘OX’ axis represents demand of tea and OY axis represents price of coffee. Increase in the price of coffee from OY to OY2 leads to increase in the demand of tea from OQ to OQ2.
Question 22.
Arc method.
Answer:
Arc method is the elasticity at the mid point of an Arc of a demand curve it studies a portion of the demand curve between two points. This is used when the change in price is not very large.
np = \(\frac{Change in the quantity demand}{\sqrt{Original quantity + New quantity}}\) \(\frac{\text { Change in the price }}{\text { Old price }+ \text { New price }}\)
Question 23.
Average Cost.
Answer:
If we divided total cost by the number of units produced, we will get average cost. Average cost means cost per unit of output. If we add average fixed cost and average variable cost, we get average total cost. As production increases in the first stage. The average cost decreases after a stage average cost increases. As a result of above changes the average cost curve is TJ’ shaped.
Average Cost = \(\frac{\text { Total Cost }}{\text { Output }}\)
(or) AC = AFC + AVC
Question 24.
Monopolistic Competition.
Answer:
It is a market where several firms produce same commodity with small differences is called Monopolistic competition. In this market producers to produce close substitute goods. Ex : Soaps, Cosmetics etc.
![]() .
.
Question 25.
Price Discrimination.
Answer:
A monopolist can change different prices for the same product for different buyers provided these buyers from ‘different markets’ or belong to non-competing groups. This is known as discriminating monopoly or price discrimination. The product may be differentiated by time, place or appearance. Price discrimination is profitable only when elasticity of demand for product differs from market to market.
Question 26.
Real Wages.
Answer:
The amount of goods and services that can be purchased with the money wages at any particular time is called real wage. Thus real wage is the amount of purchasing power received by worker through his money wage. Real wage, as such depends on two factors (1) Amount of money wage and (2) The price level. The real wage can be measured as follows.
where R = Real wage, W = Money wage, P = Price level
Real wages are considered to be the best index of measuring the economic welfare of the workers.
Question 27.
Net Interest.
Answer:
Net interest is the reward for the service of the capital loan. Ex : Net interest paid on government bonds and government loAnswer:
Question 28.
Per Capita Income.
Answer:
National income when divided by countries population.
Per capita income = \(\frac{\text { National income }}{\text { total population }}\)
The average standards of living of country is indicated by per capita income.
Question 29.
Say’s law of markets.
Answer:
J.B. Say, a French economist advocated the famous ‘Law of markets’ on which the classical theory of employment is based. According to this law “Supply creates its own demand”. According to this law whenever additional output is created, the factors of production which participate in that production receive incomes equal to that value of that output.
Question 30.
Fiscal Deficit.
Answer:
Fiscal deficit is the difference between the total expenditure and total revenue minus the market borrowings.
Fiscal deficit = (Total revenue – Total expenditure) + market borrowings and other liabilities.
Question 31.
Liquidity.
Answer:
Liquidity means the ease with which one can convert a financial asset into a medium of exchange. Liquidity is greatest for money as an asset into a medium of exchange. It is greatest for money as an asset because money itself is a medium of exchange. Infact money is the only asset which possess perfect liquidity.
![]() .
.
Question 32.
Currency.
Answer:
Currency is the form in which money is circulated in the economy by the monetary authority i.e., the government and the central bank currency includes coins and paper notes. It is only- one component of money. Money comprises of not only currency but demand deposits and time deposits also.
Question 33.
Overdraft.
Answer:
Overdraft is permissable on current account only. The current account holders are given the facility overdrafts by which they are allowed to draw an amount above their balances. However they can overdraw the amount upto a certain limit fixed by the bank.
Question 34.
Inflation.
Answer:
The term inflation refers to persistent rise in the general price level over a long period of time. Money supply increase money value will be fallen results is purchasing power will be decline.
Question 35.
What is Arithmetic Mean?
Answer:
Arithmetic mean of a statistical data is defined as the quotient of the sum of all the items of entries divided by the number of items.
Question 36.
Find the mode for the data
11, 28, 25,13, 28,28, 21, 28,16,28.
Answer:
From the above data the number how many times repeated is known as Mode. Hence the value of mode is equal to 28.
Question 37.
What is Median?
Answer:
Median is the middle element when the data set is arranged in order of the magnitude. Median is that positional value of the variable which divides the distribution into two equal parts.