The strategic use of AP Inter 1st Year Economics Model Papers and AP Inter 1st Year Economics Question Paper March 2016 allows students to focus on weaker areas for improvement.
AP Inter 1st Year Economics Question Paper March 2016
Note : Read the following instructions carefully :
- Answer ALL the questions as per the choice specified. Draw suitable diagrams wherever necessary.
- Questions from Serial Nos. 1 to 5 in Section ‘A’ are of Long Answer Type. Each question carries TEN marks. ANY THREE questions j may be answered out of five given questions. Every answer may he limited to 40 lines.
- Questions from Serial Nos. 6 to 17 in Section ‘B’ are of Short Answer Type. Each question carries FIVE marks. ANY EIGHT questions may be answered out of twelve given questions. Every answer may be limited to 20 fines.
- Questions from Serial Nos. 18 to 37 in Section ‘C’ are of Very Short Answer Type. Each question carries TWO marks. ANY FIFTEEN questions may be answered out of twenty given questions. Every answer may be limited to 5 fines.
Section – A
Note : Answer ANY THREE out of the following five questions. (3 × 10 = 30)
Question 1.
Explain the law of Diminishing marginal utility and what are its limitations.
Answer:
Hermann Heinrich Gossen was the first economist to explain the law of diminishing marginal utility in 1854. It is also known as Gossen’s ‘first law’. In 1890 Marshall in his principles of economics developed and popularised this analysis. This law explains the functional relationship between the stock of commodity the marginal utility of commodity.
According to Marshall “The additional benefit which a person derives from a given increase of his stock thing diminishes with every increase in stock that he already has”. “A consumer increases the consumption of any one commodity keeping constant the consumption of all other commodities the marginal utility of the variable commodity must eventually decline”. Kenneth E. Boulding.
The law says that as we gone consuming a commodity satisfaction derives from its additional units goes on diminishes. Assumptions :
- Rationality: Consumer is a rational man which means he always tries to get maximum satisfaction.
- Cardinal measurement of utility: Utility is a cardinal concept, i.e., utility can be measured and compared numerically.
- Utilities are independent: It implies that utility of any commodity depends as its own quantity.
- Homogeneous : Units of the commodity are similar in quantity, size, taste and colour etc.
- No time gap : There should not be any time gap between the consumption of one unit and other it.
- Constant marginal utility: It is assumed that the marginal utility of money remains constant.
- Total & marginal utility :
- Total utility : Total satisfaction obtained by the consumer from the consumption of a given quantity of commodity.
TUn = f(Qn)
Where TUn = Total utility of n commodity
F = functional relationship
Qn = Quantity of n commodity - Marginal utility: Marginal utility is the addition made to the total utility by consuming one more unit of the commodity.
It can be explained as.
MUn = TUn – TUn-1
MUn = Marginal utility of nth unit
TUn = Total utility of nth unit
TUn-1 = Total utility of n-1 units
MU may also be expressed as follows .
Marginal utility is the additional utility derived from the consumption of an extra unit of commodity.
MU = \(\frac{\Delta \mathrm{TU}}{\Delta \mathrm{C}}\)
Where ΔTU = change in total utility
ΔC = change in number of units consumed.
- Total utility : Total satisfaction obtained by the consumer from the consumption of a given quantity of commodity.
Explanation of the law :
The law of diminishing marginal utility explains the relation between the quantity of good and its marginal utility. If a person goes on increasing his stock of a thing, the marginal utility derived from an additional unit declines. We show this tendericy with an imaginary table given below.
| Unit of x apples | Total utility | Marginal utility |
| 1 | 40 | 40 – 0 = 40 |
| 2 | 70 | 70 – 40 = 30 |
| 3 | 90 | 90 – 70 = 20 |
| 4 | 100 | 100 – 90 = 10 |
| 5 | 100 | 100 – 100 = 0 |
| 6 | 90 | 90 – 100 = -10 |
In this table let us suppose that one is fond of apples. As he consumes one apple after another he derives less and less satisfaction. The first unit consumed with atmost pleasure. For the second, the intensity of his desire diminishes. The third will be still less and so on. The total utility increasing until the consumption of fourth unit of good but diminishing rate. Fifth unit of apple gives him maximum total utility. But marginal utility becomes zero. Further consumption of sixth unit TU diminishes and MU becomes negative. The relationship between total utility and marginal utility is explained in the following three ways.
- When total utility increases at diminishing rate, marginal utility falls.
- When total utility is maximum, marginal utility becomes zero.
- When total utility decreases, marginal utility becomes negative.
This can be shown in the following diagram.
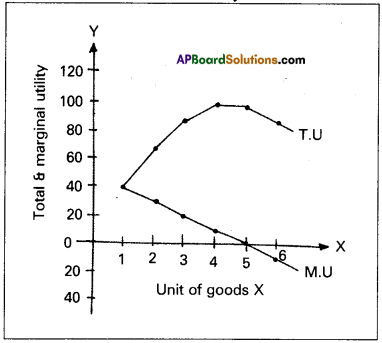
In the diagram on ‘X’ axis measures units of apples and OY axis measures total utility and marginal utility. TU curve represents total utility and MU curve represents marginal utility. TU curve is maximum at 5th unit where MU curve will become zero. TU curve slopes downwards from 6th unit, while MU will become negative.
Limitations or Exceptions :
- Hobbies:
This law does not operate in the case of hobbies like collection of stamps, old paintings, coins etc. Greater the col-lections of a person, greater is his satisfaction. Marginal utility will not diminish. - Drunkers:
It is pointed out that the consumption of liquor is not subject to the law of diminishing marginal utility. The more a person drinks liquor, the more he likes it. - Miser:
This law does not apply to money. The more money a person has the greater is the desire to acquire still more of it. - Further this law does not hold good if any change in in-come of the consumer, tastes and preferences.
![]() .
.
Question 2.
Explain the law of Variable Proportions.
Answer:
The law of variable proportions has been developed by the 19th century economists David Ricardo and Marshall. The law is associated with the names of these two economists. The law states that by increasing one variable factor and keeping other factors constant, how to change the level of output, total output first increases at increasing rate, then at a diminishing rate and later decreases. Hence this law is also known as the “Law of diminishing returns”.
Marshall stated in the following words. “An increase in capital and labour applied in the cultivation of land causes in general less than proportionate increase in the amount of produce raised, unless it happens to coincide with an improvement in the arts of agriculture”.
Assumptions :
- The state of technology remain constant.
- The analysis relates to short period.
- The law assumes labour in homogeneous.
- Input prices remain unchanged.
Explanation of the Law :
Suppose a farmer has ‘4’ acres of land he wants to increase output by increasing the number of labourers, keeping other factors constant. The changes in total production, average product and marginal product can be observed in the following table.
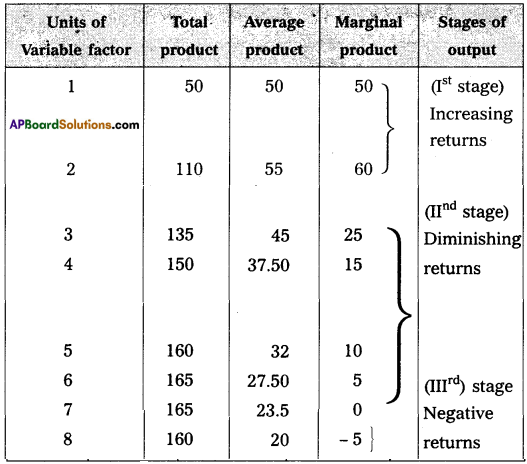
In the above table total product refers to the total output produced per unit of time by all the labourers employed. Average product refers to the product per unit of labour marginal product refers to additional product obtained by employ-ing an additional labour. In the above table there are three stages of production.
1st stage i.e., increasing returns at 2 units total output increases average product increases and marginal product reaches maximum
2nd stage i.e., diminishing returns from 3rd unit onwards TP increases diminishing rate and reaches maximum, MP becomes zero, AP continuously decreases.
3rd stage i.e., negative re¬turns from 8th unit TP decreases AP declines and MP becomes negative. This can be explained in the following diagram.
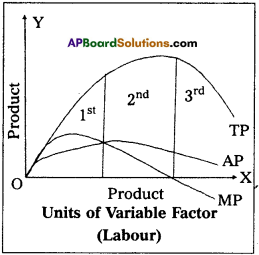
In the diagram on ‘OX’ axis shown units labourer and ‘OY axis show TR MP, and A.P 1st stage TP AP increases MP is maxi-mum. In the 2nd stage TP maximum, AP decrease MP is zero. At 3rd stage TP declines, AP also declines, MP becomes negative.
Question 3.
What is market? Explain the classification of markets.
Answer:
Refer Q.No. 3 in Model Paper – 3
Question 4.
What is national income ? Explain the various methods of calculating National Income.
Answer:
National Income is the value of all final goods and services produced in a year in a country. There are three methods of measuring national income.
- Output method or Product method
- Expenditure method
- Income method
‘Carin cross’ says national income can be looked in any one 1 of the three ways. As the national income measured by adding up everybody’s income by adding up everybody’s output and by adding up the value of all things that people buy and adding in their savings.
1) Output method (Product method):
The market value of total goods and services produced in an economy in a year is considered for estimating National Income. In order to arrive at the value of the product services, the total goods and services produced are multiplied with their market prices.
Then National Income = (PrQ1 + P2Q2 + …. PnQn) – Depreciation – Indirect taxes + Net income from abroad.
Where P = Price
Q = Quantity
1,2, 3 n = Commodities & services
There is a possibility of double counting. Care must be taken to avoid this. Only final goods and services are taken to compute national. Income but not the raw materials or intermediary goods.
Estimation of the national income through this method will indicate the contribution of different sectors, the growth trends in each sector and the sectors which are lagging behind.
2) Expenditure method:
In this method we add the per-sonal consumption expenditure of households, expenditure of the firms, government purchase of goods and services net exports plus net income from abroad.
NI = EH + EF + EG + Net exports + Net income from abroad. Here National Income = Private final consumption expen-diture + Government final consumption expenditure + Net domestic capital formation + Net exports + Net income from abroad.
EH = Expenditure of households
EF = Expenditure of firms
EG Expenditure of government
Care should be taken to include spending or expenditure made on final goods and services only.
3) Income method:
In this method, the incomes earned by all factors of production are aggregated to arrive at the national Income of a country. The four factors of production receive in-comes in the form of wages, rent, interest and profits. This is also national inobme at factor cost.
NI = W + I + R + P + Net income from abroad
NI = National income
W = Wages
I = Interest
R = Rent
P = Profits
This method gives us National Income according to distrib-ute shares.
![]()
Question 5.
Explain the Keynesian theory of Employment.
Answer:
Keynes theory of employment is the principle of effective demand. He called his theory, general theory because it deals with all levels of employment. Keynes explains that lack of aggregate demand is the cause of unemployment. He used the terms aggregate demand, aggregate supply. It means total. The term effective demand is used to denote that level of aggregate demand which is equal to aggrerate supply.
According to Keynes where aggregate demand and aggre¬gate supply are intersected at that point effective demand is deter-mined. This effective demand will determine the level of employ-ment.
Aggregate supply schedule:
The aggregate supply schedule shows the various amounts of the commodity that will be offered for sale at a series of price. As the level of output increases with the level of employment. The aggregate supply price also increases with every increase in the level of employment. The aggregate sup¬ply curve slopes upwards from left to right. But when the economy reaches the level of the full employment, the aggregate supply curve becomes vertical.
Aggregate demand schedule:
The various aggregate de¬mand prices at different level of employment is called aggregate demand price schedule. As the level of employment rises, the total income of the community also rises, and therefore the aggregate demand price also increases. The aggregate demand curve slopes upward from left to right.
Equilibrium level of income:
The two determinants of effective demand aggregate supply and aggregate demand prices combined schedule is shown in the following table.
| Level of employment (in lakhs of workers) | Aggregate supply price (in crores of Tf | Aggregate demand price (in crores of ₹) |
| 20 | 200 | 175 |
| 30 | 250 | 225 |
| 40 | 300 | 300 AD = AS |
| 50 | 350 | 325 |
| 60 | 400 | 425 |
The table shows that so long as the demand price is higher than the aggregate supply price. The level of employment 40 lakh workers aggregate demand price is equal to aggregate supply price i.e., 300 crores. So effective demand in the above table is ₹300 crores. This can be shown in the following diagrams.
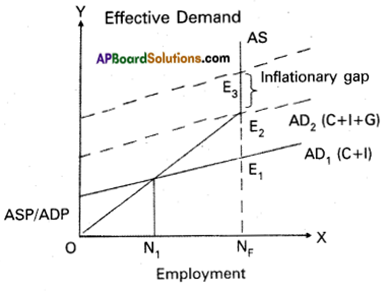
In the above diagram ‘X’ axis represents the employment and V axis represents price. A.S is aggregate supply curve A.D is aggregate demand curve. The point of intersection between the two Ej & E2 points. This is effective demand where all workers are employed at this point the entrepreneurs expectation of profits are maximised. At any other points the entrepreneurs will either incur losses or earn sub-normal profits.
Section – B
Note : Answer ANY THREE out of the following five twelve question (8 × 5 = 40)
Question 6.
Explain the Jacob Viner’s definition.
Answer:
Jacob Viner’s definition of economics is considered as modem definition of economics. He is an American economist known for his short run and long run cost curve analysis. According to Jacob Viner” Economics is what economists do”. The problem of the economy are.
- What to produce and in what quantities : The economy has to decide whether to produce consumer goods and capital goods. These decisions are influence by individuals as well as government.
- How to produce these goods : A decision has to be made whether to use labour intensive or capital intensive techniques.
- For whom to produce these goods and services : It is concernned with the distribution of income and wealth among different sections of the society.
- How efficient the productive resources are in use : This refers to the efficiency of economic system.
- Whether the available resources are fully utilised : If resources are fully utilised that it can provide more employment opportunities.
- Is the economy growing or static over a period of time.
Question 7.
Characteristics of wants.
Answer:
Human wants are starting point of all economic activities. They depend on social and economic conditions of individuals. Characteristic features of wants :
1) Unlimited wants:
Human wants are unlimited. There is no end to human wants. When one want is satisfied an-other want takes its place. Wants differ from person to per¬son, time to time and place to place.
2) A particular want is satiable:
Although a man cannot satisfy all his wants, a particular want can be satisfied completely in a period of time. Ex : If a person is thirsty he can satisfy it by drinking a glass of water.
3) Competition:
Human wants unlimited. But the means to satisfy them are limited of scarce. Therefore they eom- plete with each other in priority of satisfaction.
4) Complementary:
To satisfy a particular want we need a group of commodities at the same time. Ex : Writing need is satisfied only when we have pen, ink and paper together. ‘
5) Substitution:
Most of our wants can be satisfied by dif-ferent ways. Ex : If we feel hungry, we take some food and satisfy this want.
6) Recurring :
Many wants appear again and again thought – they are satisfied at one point of time.
7) Habits : Wants change into habits, which cannot be given up easily. Ex: Smoking cigarettes for joke results into a habit if it is not controlled.
8) Wants vary with time, place and person:
Wants go on changing with the passage of time. They are changing , from time to time, place to place and person to person.
Human wants are divided into
- Necessities
- Comforts and
- Luxuries.
![]()
Question 8.
Properties of Indifference curve.
Answer:
It represents the satisfaction of a consumer from two goods of various combinations.
Properties :
- Indifference curves slopes downwards from left to right there exists negative slope.
- Indifference curves are convex to the origin because of; diminishing marginal rate of substitution.
- Indifference curves can never intersect each other.
- Higher indifference curve represent higher level of satisfaction. Indifference curve to the right represents higher satisfaction.
![]()
Question 9.
What are the factors that determine Demand?
Answer:
The law of demand explaing the functional relation between price and demand. There are several factors which determine demand.
Factors of demand :
- Price of commodity: The demand for any good depends on its price, more will be demanded at lower price and vice-versa.
- Prices of substitutes and complementaries : Demand is influenced by changes in price of related goods either substitutes or complementary goods. Ex : Increase in the price of coffee leads an increase in the demand for tea in the case of substitutes positive relation and complementaries negative relationship between price and demand.
- Income of the consumer: Demand always changes with a change in the incomes of the people. When income increases the demand for several commodities increases and vice-versa.
- Population: A change in the size and composition of popu¬lation will effect the demand for certain goods like food grains, clothes etc.
- Taste and preferences : A change in the taste and the fashions bring about a change in the demand for a com-modity.
- Technological changes : Due to economic progress technological changes the quantity the quality of goods available to the cosumers increase. Ex : Demand for cell phones reduced the demand for landline phones.
- Change in the weather : Demand for commodity may change due to change in a climatic condition.
Ex : During summer demand for cool drinks, in winter demand for wollen clothes. - State of business : During the period of prosperity demand for commodities will expand and during depres-sion demand will contract.
Question 10.
Explain the exceptions to he law of Demand.
Answer:
Demand means a desire which is backed up by ability to buy 1 and willingness to pay the price is called Demand. Thus demand will be always to a price and time demand has the following features.
- Desire for the commodity
- Ability to buy the commodity
- Willing to pay the price of commodity
- Demand is always at a price
- Demand is per unit of time i.e, per day, week etc. Therefore the price demand may be expressed in the form of small equation.
Dx = f(Px)
Price demand explains the relation between price and quantity demanded of a commodity. Price demand states that there is an inverse relationship between price and demand.
Law of demand:
Marshall defines the law of demand as, “The amount demanded increases with a fall in price and diminishes with arise in price when other things remain the same”. So, the law of demand explains the inverse relationship between the price and quantity demanded of a commodity.
Demand schedule:
It means a list of the quantities demanded at various prices in a given period of time in a market. An imaginary example given below.
| Price in ₹ | Quantify Demanded units |
| 5 | 10 |
| 4 | 20 |
| 3 | 30 |
| 2 | 40 |
| 1 | 50 |
The table shows that as ‘ the price falls to ₹1/- the quantity demanded 50 units, when price ₹5/- he is buying 10 units. So, there is inverse relationship between price and demand. Price is low demand will be high and price is high demand will be low. We can illustrate the above schedule in a diagram.
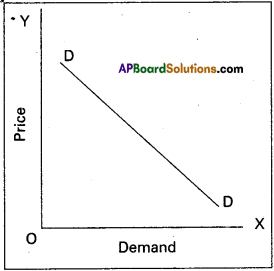
In the above diagram on X-axis demand is shown and price is on Y-axis. DD is the demand curve. Demand curves slopes downward from left to right.
Assumptions :
- No change in the income of consumer
- The taste and preferences consumers remain same.
- The prices of related goods remain the same.
- New substitutes are not discovered.
- No expectation of future price changes.
Exceptions:
In certain situations, more will be demanded at higher price and less will be demanded at a lower price. In such cases the demand curve slopes upward from left to right which is called an exceptional demand curve. This can be shown in the following diagram
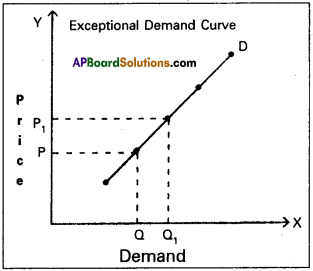
In the diagram when price increases from OP to OP1( de-mand also increases from OQ to OQ1. This is opposite to law of demand.
1) Giffen’s Paradox :
This was stated by Sir Robert Giffen. He observed that poor people will demand more of inferior goods, if their prices , aise. Inferior goods are known as Giffen goods.
Ex : Ragee, Jowar etc. He pointed out that in case of the English workers, the law of demand does not apply to bread. Giffen noticed that workers spend a major portion of their income on bread and only small portion on meat.
2) Veblen Effect (Prestigious goods):
This exception was stated by Veblen. Costly goods like diamonds and precious stones are called prestige goods or veblen goods. Generally rich people purchase those goods for the sake of prestige. Hence rich people may buy more such goods when their prices rise.
3) Speculation:
When the price of a commodity rises the group of speculators expect that it will rise still further. Therefore, they buy more of that commodity. If they expect that there is a fall in price, the demand may not expand. Ex : Shares in the stock market.
4) Illusion:
Some times, consumer develop to false idea that a high priced good will have a better quality instead of low priced good. If the price of such good falls, demand decreases, which is contrary to the law of demand.
Question 11.
What are the factors that determine factor prices?
Answer:
The demand and supply of a factor of production determine its price. The demand for a factor of production depends on the following.
- It depends on the demand for the goods produced by it.
- Price of the factor determines its demand.
- Prices of other factors or co-operative factors determine the demand for a factor.
- Technological changes determine the demand for a factor.
- The demand for a factor increases due to increase in its production.
Factors that determine the supply of a factor of production.
- The size of the population and it’s age composition.
- Mobility of the factor of production.
- Efficiency of the factor of production.
- Geographical conditions.
- Wage also determines the supply of this factor.
- Income.
![]()
Question 12.
What is the national income at factor cost?
Answer:
The cost of production of good is equal to the rewards paid to the factors which participated in the production process. So the cost of production of a firm is the rent paid to land, wages paid to labour, interest paid on capital and profits of the entrepreneur. These are received by suppliers of factors of production. There is a difference between net National Income at market prices and National Income at factor of cost. Imposition of tax increases the market prices. When these taxes deducted from net National Income, remaining income gets distributed among the factors of production
Sometimes, the government may offer subsidies to encour-age production of certain goods. The market prices of such goods will decrease to that extent. The value of subsidies is not included in net national product. So, it is to be added. National Income at factor cost = NNP + Subsidies – Indirect
taxes.
Question 13.
List out various items of public expenditure.
Answer:
Public expenditure is an important constituent of public finance. Modem governments spend money from various welfare activities. The expenditure incurred by the government on various economic activities is called public expenditure. Governments incur expenditure on the following heads of accounts.
- Defence
- Internal security
- Economic services
- Social services
- Other general services
- Pensions
- Subsidies
- Grants to state governments
- Grants to foreign governments
- Loans to state governments
- Loans to public enterprises
- Loans to foreign governments
- Repayment of loans
- Assistance to states on natural calamities etc.
Question 14.
What are the sources of public revenue?
Answer:
Revenue received by the government from different sources is called public revenue. Public revenue is classified into two kinds. 1) Tax revenue 2) Non-Tax revenue.
1) Tax Revenue:
Revenue received through collection of taxes from the public is called tax revenue. Both the state and central government collect taxes as per their allocation in the constitution.
Taxes are two types.
a) Direct taxes:
i) Taxes on income and expenditure.
Ex : Income tax, Corporate tax etc.
ii) Taxes on property and capital assests.
Ex : Wealth tax, Gift tax etc.
b) Indirect taxes : Taxes levied on goods and services.
Ex : Excise duty, Service tax.
2) Non – tax revenue : Government receives revenue from sources other than taxes and such revenue is called non-tax rev-enue. They are
a) Administrative revenue: Government receives money for certain administrative services. Ex: License fee, Tution fee etc.
b) Commercial revenue : Modern governments establish public sector units to manufacture certain goods and offer certain services. The goods and services are ex-changed for the price. So such units earn revenue by way of selling their products. Ex : Indian Oil Corporation, Bharath Sanchar Nigam Ltd, Bharath Heavy Electricals, Indian Railways, State Road Transport Corporations, Indian Air lines etc.
![]()
Question 15.
State the objectives of a Central Bank or Reserve Bank.of India.
Answer:
The classical theory of employment came in for severe criticism from J.K. Keynes. The main points of criticism are as follows :
- The assumption of full employment is unrealistic. It is rare phenomenon and not a normal features.
- The wage cut policy is not a practical policy in modem times. The supply of labour is a function of money wage and not real wage. Trade unions would never accept any reduction in the money wage rate.
- Equilibrium between savings and investment is not brought about by a flexible rate of interest. Infact, savings a function of income and not interest.
- The process of equilibrium between supply and demand is not realistic. Keynes commented the self adjusting mechanism does not always operate.
- Long run approach to theproblem of unemployment is also not realistic. Keynes commented, ‘We are all dead in the long run”. He considered unemployment as a short run problem and offered immediate solution through his employment theory.
- It is not correct to say that money is neutral money acts not only as a medium of exchange but also as a store of value money influences variables like consumption, investment and output.
Question 16.
Enumerate the measures for control of Inflation.
Answer:
To control the inflation the government has taken various steps. They are:
- Increase the production in the long term.
- Implementing proper monetary and fiscal policies to reduce the supply of money and credit.
- Controlling prices and eliminating black market.
- Importing the goods which are scarer in supply from outside countries.
- Introducing rational and quota system in case of mass . communication of consumption of goods.
- Distribution of goods to all the needy sections of the people.
Question 17.
Explain the relationship between Economics and Statistics.
Answer:
There is close relationship between statistics and economics. In the words of Tugwell ‘The science of economics is becoming statistical in its method”. All the economic laws are pronounced on the basis of statistical facts and figures. The theory of population of Malthus, law of family expenditure of Engels etc., were propounded after statistical tests. Statistics helps the economics to become an exact science.
In the study of theoretical ‘economics, the application and use of statistical methods are of great importance. Most of the doctrines of economics are based on the study of a large number of units and their analysis. This is done through statistical methods. Law of demand was formulated because of statistical methods.
The importance statistics is felt in all branches of knowledge in accountancy and auditing in banking, in insurance, in research and many fields. Without statistics no branch of knowledge is complete.
Section – C
Note : Answer ANY EIGHT out of the following twelve question (15 × 2 = 30)
Question 18.
Utility.
Answer:
Utility has great significance in the study of economics. It means the want satisfying power of a commodity. It is a subjective concept. No one can measure or estimate it in mathematical terms. Utility is of four types namely Form utility, Time utility, Place utility and Service utility.
Question 19.
Wealth.
Answer:
Wealth means stock of assets held by an individual or institution that yields has the potential for yielding income in some “ form. Wealth includes money, shares of companies, land etc. Wealth has three properties. 1) Utility 2) Scarcity 3) Transferablity.
Question 20.
Price line/Budget line.
Answer:
The budget line shows all possible combinations of two goods that a consumer can buy with the given income of the consumer and prices of the two goods budget line is also known as price line. ‘
Question 21.
Giffen Paradox/Giffen Goods.
Answer:
It means necessary goods Sir Robert Giffen in mid 19th century observed that the low paid workers in England purchased more bread when its price increase’By decrease in the purchase of meat. The increase in demand for bread when price increased is an exception to the law of demand, it is known as Giffen’s paradox.
![]()
Question 22.
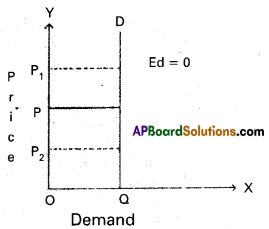
Perfectly Inelastic Demand.
Answer:
Perfectly Inelastic demand : It is also known as “zero elastic demand”. In this case even a great rise or fall in price does not lead to any change in quantity demanded is known as perfectly inelastic
Question 23.
Law of supply.
Answer:
The supply of a commodity means the total quantity of the commodity that sellers offer to sell at different prices from the stock of that commodity existing at any given time. It other things are assumed to be constant, the relation between price and supply is known as law of supply. Here as price increases supply also increases. As price falls supply falls.
Question 24.
Monopoly.
Answer:
Mono means single, Poly means seller. In this market single seller and there is no close substitutes. The monopolist is a price maker.
Question 25.
Price discrimination.
Answer:
Monopolist will charge different prices for the same commodity or service in the market. This is known as discrimi-nating monopoly or price discrimination.
Question 26.
Real wages.
Answer:
The amount of goods and services that can be purchased with the money wages at any particular time is called real wage. Thus real wage is the amount of purchasing power received by worker through his money wage.
Question 27.
Contract Rent.
Answer:
It is the hire charges for any durable good. Ex: cycle rent, room rent etc. It is a periodic payment made for the use of any material good. The amount paid by the tenant cultivator to the landlord annually may be also called contract rent. Ex : The rent that a tenant pays to the house owner monthly as per an agreement made earlier or the hiring charges of a cycle ₹ 10 per hour is also contract rent.
Question 28.
Per Capita Income.
Answer:
It is average income received by a citizen of a country in a year. We arrive at percapita income by dividing the national income with the population of a country.
Percapita income = \(\frac{National income}{\sqrt{Population}}\)
Question 29.
Say’s law of markets.
Answer:
J.B. Say a french economist advocated the famous “Law of Market’s” oh which the classical theory of employment is based. According to this law “Supply creates its own demand”. According to this law whenever additional output is created the factors of production which participate in that production receive incomes equal to that value of that output. This income would be spent either on consumption goods or on capital goods. Thus additional demand is created matching the additional supply.
Question 30.
Effective Demand.
Answer:
It is that aggregate demand which becomes equal to the aggregate supply. This refers to the aggregate demand at equilibrium.
Question 31.
Liquidity.
Answer:
Liquidity means the ease with which one can convert a financial asset into a medium of exchange. Liquidity is greatest: for money as an asset because money itself is a medium of exchange. Infact money is the only asset which possess perfect liquidity.
Question 32.
Overdraft.
Answer:
Over draft is permissable on current account only. The current account holders are given the facility of overdrafts by which they are allowed to draw on amount above their balances. However they can overdraw the amount upto a certain limit fixed by the bank.
Question 33.
Currency.
Answer:
Currency consists of paper notes and coins paper notes are issued by the government or the central bank of a country. In india the reserve bank which is the central bank of india issue currency notes at all denominations except one rupee notes. The government of india issue them coins are metallic tokens and are produced in the mints of government. 1
![]()
Question 34.
Hyperinflation.
Answer:
Hyper inflation is also known as galloping inflation. If the inflation rate exceeds 10% per annum is called Hyper inflation. The rate of inflation may go upto 100% or even more. This is highly dangerous and totally upsets the economy.
Question 35.
What is Arithmetic Mean?
Answer:
Arithmetic mean of a statistical data is defined as the quotient of the sum of all the items or entries divided by the number of items. Arithmetic mean or simple mean is the most commonly and widely used measured of central tendency.
Question 36.
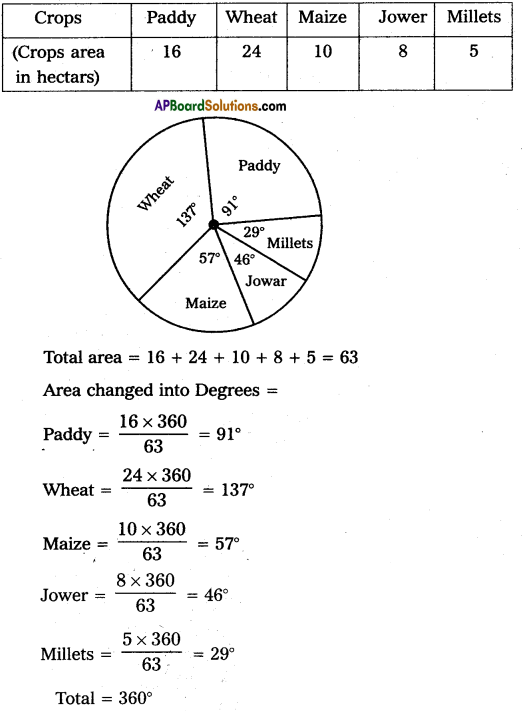
What is a ‘Pie’ diagram?
Answer:
This diagram enables us to show the partitioning of total into component parts. It is also called a pie chart. Ex : Draw the pie digram for following data.
Total area = 16 + 24 + 10 + 8 + 5 = 63
Area changed into Degrees =
Question 37.
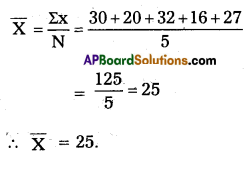
Find the Arithmetic Mean for the following data 30, 20, 32, 16, 27
Answer: