The strategic use of AP Inter 1st Year Economics Model Papers and AP Inter 1st Year Economics Question Paper March 2017 allows students to focus on weaker areas for improvement.
AP Inter 1st Year Economics Question Paper March 2017
Note : Read the following instructions carefully :
- Answer ALL the questions as per the choice specified. Draw suitable diagrams wherever necessary.
- Questions from Serial Nos. 1 to 5 in Section ‘A’ are of Long Answer Type. Each question carries TEN marks. ANY THREE questions j may be answered out of five given questions. Every answer may he limited to 40 lines.
- Questions from Serial Nos. 6 to 17 in Section ‘B’ are of Short Answer Type. Each question carries FIVE marks. ANY EIGHT questions may be answered out of twelve given questions. Every answer may be limited to 20 fines.
- Questions from Serial Nos. 18 to 37 in Section ‘C’ are of Very Short Answer Type. Each question carries TWO marks. ANY FIFTEEN questions may be answered out of twenty given questions. Every answer may be limited to 5 fines.
Section – A
Note : Answer ANY THREE out of the following five questions. (3 × 10 = 30)
Question 1.
Explain the law of diminishing marginal utility. What are its limitations?
Answer:
Hermann Heinrich Gossen was the first economist to explain the law of diminishing marginal utility in 1854. It is also known as Gossen’s ‘first law’. In 1890 Marshall in his principles of economics developed and popularised this analysis. This law explains the functional relationship between the stock of commodity the marginal utility of commodity.
According to Marshall “The additional benefit which a person derives from a given increase of his stock thing diminishes with every increase in stock that he already has”. “A consumer increases the consumption of any one commodity keeping constant the consumption of all other commodities the marginal utility of the variable commodity must eventually decline”. Kenneth E. Boulding.
The law says that as we gone consuming a commodity satisfaction derives from its additional units goes on diminishes.
Assumptions :
- Rationality: Consumer is a rational man which means he always tries to get maximum satisfaction.
- Cardinal measurement of utility : Utility is a cardinal concept, i.e., utility can be measured and compared numerically.
- Utilities are independent : It implies that utility of any commodity depends as its own quantity.
- Homogeneous : Units of the commodity are similar in quantity, size, taste and colour etc.
- No time lag : There should not be any time lag between the consumption of one unit and other it.
- Constant marginal utility: It is assumed that the marginal utility of money remains constant.
- Total & marginal utility:
i) Total utility: Total satisfaction obtained by the consumer from the consumption of a given quantity of commodity.
TUn = f(Qn)
Where TUn = Total utility of n commodity,
F = functional relationship,
Qn = Quantity of n commodity.
ii) Marginal utility: Marginal utility is the addition made to the total utility by consuming one more unit of the commodity. It can be explained as.
MUn = TUn – TUn-1
MUn = Marginal utility of nth unit
TUn = Total utility of nth unit TUn
TUn-1 = Total utility of n-1 units.
MU may also be expressed as follows.
Marginal utility is the additional utility derived from the consumption of an extra unit of commodity.
MU = \(\frac{\Delta \mathrm{TU}}{\Delta \mathrm{C}}\)
Where ∆TU = Change in total utility AC = Change in number of units consumed.
Explanation of the law:
The law of diminishing marginal utility explains the relation between the quantity of good and its marginal utility. If a person goes on increasing his stock of a thing, the marginal utility derived from an additional unit declines. We show this tendency with an imaginary table given below.
| Unit of x apples | Total utility | Marginal utility |
| 1 | 40 | 40 – 0 = 40 |
| 2 | 70 | 70 – 40 = 30 |
| 3 | 90 | 90 – 70 = 20 |
| 4 | 100 | 100 – 90 = 10 |
| 5 | 100 | 100 – 100 = 0 |
| 6 | 90 | 90 – 100 = -10 |
In this table let us suppose that one is fond of apples. As he consumes one apple after another he derives less and less satisfaction. The first unit consumed with atmost pleasure. For the second, the intensity of his desire diminishes. The third will be still less and so on. The total utility increasing until the consumption of fourth unit of good but diminishing rate. Fifth unit of apple gives him maximum total utility. But marginal utility becomes zero. Further consumption of sixth unit TU diminishes and MU becomes negative.
The relationship between total utility and marginal utility is explained in the following three ways.
- When total utility increases at diminishing rate, marginal utility falls.
- When total utility is maximum, marginal utility becomes zero.
- When total utility decreases, marginal utility becomes nega-tive. This can be shown in the following diagram.
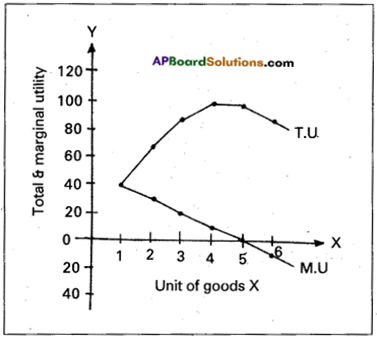
In the diagram on ‘X’ axis measures units of apples and OY axis measures total utility and marginal utility. TU curve represents total utility and MU curve represents marginal utility. TU curve is maximum at 5th unit where MU curve will become zero. TU curve slopes downwards from 6th unit, while MU will become negative.
Limitations or Exceptions:
- Hobbies:
This law does not operate in the case of hobbies like collection of stamps, old paintings, coins etc.
Greater the collections of a person, greater is his satisfaction. Marginal utility will not diminish. - Drunkers:
It is pointed out that the consumption of li¬quor is not subject to the law of diminishing marginal utility. The more a person drinks liquor, the more he likes it. - Miser:
This law does not apply to money. The more money a person has the greater is the desire to acquire still more of it. - Further, this law does not hold good if any change in income of the’ consumer, tastes and preferences.
![]()
Question 2.
Explain the law of variable proportions.
Answer:
The law of variable proportions has been developed by the 19th century economists David Ricardo and Marshall. The law is associated with the names of these two economists. The law states that by increasing one variable factor and keeping other factors constant, how to change the level of output, total output first increases at increasing rate, then at a diminishing rate and later decreases. Hence this law is also known as the “Law of Diminishing Returns”.
Marshall stated in the following words. “An increase in capital and labour applied in the cultivation of land causes in general less than proportionate increase in the amount of produce raised, unless it happens to coincide with an improvement in the arts of agriculture”.
Assumptions:
- The state of technology remain constant.
- The analysis relates to short period.
- The law assumes labour in homogeneous.
- Input prices remain unchanged.
Explanation of the Law:
Suppose a farmer has ‘4’ acres of land he wants to increase output by increasing the number of labourers, keeping other factors constant. The changes in total production, average product and marginal product can be observed in the following table.
| Units of Variable factor | Total product | Average product | Marginal product
|
Stages of output |
| 1 | 50 | 50 | 50
60 |
Stages of output
(Ist stage) Increasing returns |
| 2 | 110 | 55 | ||
| 3 | 135 | 45 | 25
15 10 5 |
(IInd stage)
Diminishing returns |
| 4 | 150 | 37.50 | ||
| 5 | 160 | 32 | ||
| 6 | 165 | 27.50 | ||
| 7 | 165 | 23.5 | 0
-5 |
(IIIrd) stage
Negative returns |
| 8 | 160 | 20 |
In the above table total product refers to the total output produced per unit of time by all the labourers employed. Average product refers to the product per unit of labour marginal product refers to additional product obtained by employing an additional labour. In the above table there are three stages of production.
1st stage i.e., increasing returns at 2 units total output increases average product increases and marginal product reaches maximum.
2nd stage i.e., diminishing returns from 3rd unit onwards TP increases diminishing rate and reaches maximum, MP becomes zero, AP continuously decreases.
3rd stage i.e., negative returns from 8th unit TP decreases AP declines and MP becomes negative. This can be explained in the following diagram.
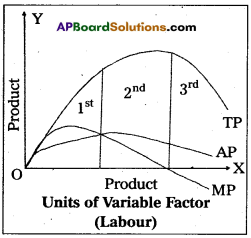
In the diagram on ‘OX’ axis shown units labourer and ‘OV axis show TP MP, and A.R 1st stage TP AP increases MP is maximum. In the 2nd stage TP maximum, AP decrease MP is zero. At 3rd stage TP declines, AP,also declines, MP becomes negative.
Question 3.
Explain the classification of markets.
Answer:
Edwards defined “Market as a mechanism by which buyers and sellers are brought together”. Hence market means where selling and buying transactions are take place. The classification of markets is based on three factors.
1. On the basis of area
2. On the basis of time
3. On the basis of competition. .
I. On the basis of area : According to the area, markets can be of three types.
- Local market:
When a commodity is sold at particular locality. It is called a local market. Ex : Vegetables, flowers, fruits etc. - National market:
When a commodity is demanded and supplied throughout the country is called national market. Ex : Wheat, rice etc. - International market:
When a commodity is demanded and supplied all over the world is called international market. Ex : Gold, silver etc.
II. On the basis of time : It can be further classified into three types.
- Market period or very short period:
In this period where producer cannot make any changes in supply of a commodity. Here supply remains constant. Ex : Perishable goods. - Short period:
In this period supply can be change to some extent by changing the variable factors of production. - Long period:
In this period supply can be adjusted in according change in demand. In long run all factors will become variable.
III. On the basis of competition: This can be classified into two types.
- Perfect market:
A perfect market is one in which the number of buyers and sellers is very large, all engaged in buying and selling a homogeneous products without any restrictions. - Imperfect market:
In this market, competition is imperfect among the buyers and sellers. These markets are divided into- Monopoly
- Duopoly
- Oligopoly
- Monopolistic competition.
Question 4.
Explain the various methods of calculating National Income.
Answer:
The value of all final goods and services produced in a year in a country is known as National Income. There are three methods of measuring National Income.
- Output method or Product method.
- Expenditure method.
- Income method.
‘Carin cross’ says National Income can be looked in any one of the three ways. As the national income measured by adding up everybody’s income by adding up everybody’s output and by adding up the value of all things that people buy and adding in their savings.
1) Output method (Product method):
The market value of total goods and services produced in an economy in a year is considered for estimating National Income. In order to arrive at the value of the product services, the total goods and services produ¬ced are multiplied with their market prices.
Then National Income = (P1Q1 + P2 Q + …. PnQn)
– Depreciation – Indirect taxes + Net income from abroad.
Where P = Price
Q = Quantity
1,2,3 …….n = Commodities & services
There is a possibility of double counting. Care must be taken to avoid this. Only final goods and services are taken to compute National Income but not the raw materials or intermediary goods.
Estimation of the National Income through this method will indicate the contribution of different sectors, the growth trends in each sector and the sectors which are lagging behind.
2) Expenditure method:
In this method we add the personal consumption expenditure of households, expenditure of the firms, government purchase of goods and services net exports plus net income from abroad.
NI = EH + EF + EG + Net exports + Net income from abroad.
Here National Income = Private final consumption expenditure + Government final consumption expenditure + Net domestic capital formation + Net exports + Net income from abroad
EH = Expenditure of households
EF = Expenditure of firms
EG = Expenditure of Government
Care should be taken to include spending or expenditure made on final goods and services only.
3) Income method:
In this method, the incomes earned by all factors of production are aggregated to arrive at the National Income of a country. The four feu ors of production receive incomes in the form of wages, rent, interest and profits. This is also national income it factor cost.
NI = W + I + R + P + Net income from abroad
NI = National income
W = Wages
I = Interest
R = Rent
P = Profits
This method gives us National Income according to distribute shares.
![]()
Question 5.
Explain the Keynesian theory of employment.
Answer:
Keynes theory of employment is the principle of effective demand. He called his theory, general theory because it deals with all levels of employment. Keynes explains that lack of aggregate demand is the cause of unemployment. He used the terms aggregate demand, aggregate supply. It means total. The term effective demand is used to denote that level of aggregate demand which is equal to aggrerate supply. According to Keynes where aggregate demand and aggregate supply are intersected at that point effective demand is determined. This effective demand will determine the level of employment.
Aggregate supply schedule:
The aggregate supply schedule shows the various amounts of the commodity that will be offered for sale at a series of price. As the level of output increases with the level of employment. The aggregate supply price also increases with every increase in the level Of employment. The aggregate supply curve slopes upwards from left to right. But when the economy reaches the level of the full employment, the aggregate supply curve becomes vertical.
Aggregate demand schedule:
The various aggregate demand prices at different level of employment is called aggregate demand price schedule. As the level of employment rises, the total income of the community also rises and therefore the aggregate demand price also increases. The aggregate demand curve slopes upward from left to right.
Equilibrium level of income:
The two determinants of effective
demand aggregate supply and aggregate demand prices combined schedule is shown in the following table.
| Level of employment (in lakhs of workers) | Aggregate supply price (in crores of ₹) | Aggregate demand price (in crores of ₹) |
| 20 | 200 | 175 |
| 30 | 250 | 225 |
| 40 | 300 | 300 AD = AS |
| 50 | 350 | 325 |
| 60 | 400 | 425 |
The table shows that so long as the demand price is higher than the aggregate supply price. The level of employment 40 lakh workers aggregate demand price is equal to aggregate supply price i.e., 300 crores. So effective demand in the above table is ₹300 crores. This can be shown in the following diagrams.
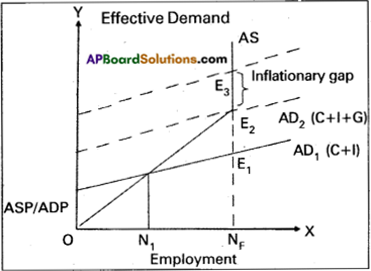
In the diagram ‘X’ axis represents the employment and ‘Y’ axis represents price. AS is aggregate supply curve A.D is aggregate demand curve. The point of intersection between the two ‘E1‘ point. This is effective demand where all workers are employed at this point the entrepreneurs expectation of profits are maximised. At any other points the entrepreneurs will either incur losses or earn sub-normal profits.
Section – B
Note : Answer ANY THREE out of the following five twelve question (8 × 5 = 40)
Question 6.
What are the characteristics of wants?
Answer:
Human wants are starting point of all economic activities. They depend on social and economic conditions of individuals.
Characteristic features of wants :
- Unlimited wants : Human wants are unlimited. There is no end to human wants. When one want is satisfied another want takes its place. Wants differ from person to person, time to time and place to place.
- A particular want is satiable : Although a man cannot satisfy all his wants, a particular want can be satisfied completely in a period of time. Ex: If a person is thirsty he can satisfy it by drinking a glass of water.
- Competition : Human wants unlimited. But the means to satisfy them are limited of scarce. Therefore they complete with each other in priority of satisfaction.
- Complementary.: To satisfy a particular want we need a group of commodities at the same time.
Ex: Writing need is satisfied only when we have pen, ink and paper together. - Substitution :Most of our wants can be satisfied by dif-ferent ways. Ex : If we feel hungry, we take some food and satisfy this want.
- Recurring: Many wants appear again and again thought they are satisfied at one point of time.
- Habits: Wants change into habits, which cannot be given up easily. Ex : Smoking cigarettes for joke results into a habit if it is not controlled.
- Wants vary with time, place and person: Wants go on changing with the passage of time. They are changing from time to time, place to place and person to person. Human wants are divided into
- Necessities,
- Comforts and
- Luxuries.
Question 7.
Explain about Jacob Viner’s definition.
Answer:
Jacob Viner’s definition of Economics is considered as modem definition of economics. He is an American economist known for his short run and longrun cost curve analysis. According to Jacob Viner” Economics is what economists do”.
The problem is of the economy are:
- What to produce and in what quantities: The economy has to decide whether to produce consumer goods and capital goods. These decisions are influence by individuals as well as government.
- How to produce these goods: A decision has to be made whether to use labour intensive or capital intensive techniques.
- For whom to produce these goods and services: It is concemned with the distribution of income and wealth among different sections of the society.
- How efficient the productive resources are in use: This refers to the efficiency of economic system.
- Whether the available resources are fully utilised: If resources are fully utilised that it can provide more employment opportunities.
- Is the economy growing or static over a period of time.
Question 8.
What are the properties of indifference curves?
Answer:
An indifference curve can be defined as the locus of points each representing a different combination of two goods yielding the same utility or level of satisfaction. Therefore, a consumer is indifferent between any two combinations of goods when it comes to making a choice between them. It is also called iso-utility curve or equal utility curve. Properties of Indifference Curves
Indifference curves have the following basic properties :
1) An indifference curve is negatively sloped towards down. It implies that when the amount of one good in combination is increased, the amount of other good is reduced. This is essential if the level of satisfaction is to remain the same on an indifference curve. It is neither positively sloped towards up nor horizontal / vertical.
2) Indifference curves are always convex to the origin. The convexity rule implies diminishing marginal rate of substitution. Indifference curves cannot be concave to the origin.
3) Indifference curves can never intersect each other. If two – IC curves intersect, it would imply that an indifference curve indicates two different levels of satisfaction. It is not proper.
4) A higher indifference curve represents a higher level of satisfaction than a lower indifference curve. In other words, an IC to the right represents more satisfaction. This is because of combinations lying on a higher IC contain more of either one or both goods. Similarly, an indifference curve to the left represents less satisfaction.
![]()
Question 9.
Explain the exceptions to the law of demand.
Answer:
In Economics demand means a desire which is backed up by ability to buy and willingness to pay the price. Thus demand will be always at a price and time. According to Marshal “The amount de¬manded increases with a fall in price and diminishes with rise in price when other things remain the same”.
Exceptions:
In certain situations, more will be demanded at higher price and less will be demanded at a lower price. In such cases the demand curve slopes upward from left to right which is called an exceptional demand curve. This can be shown in the following diagram
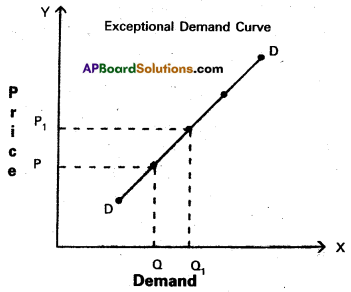
In the diagram when price increases from OP to OP1, demand also increases from OQ to OQ1 This is opposite to law of demand.
1) Giffen’s Paradox:
This was stated by Sir Robert Giffen. He observed that poor people will demand more of inferior goods, if their prices raise. Inferior goods are known as Giffen goods. Ex : Ragee, Jowar etc. He pointed out that in case of the English workers, the law of demand does not apply to bread. Giffen noticed that workers spend a major portion of their income on bread and only small portion on meat.
2) Veblen Effect (Prestigious goods):
This exception was stated by Veblen. Costly goods like diamonds and precious stones are called prestige goods or veblen goods. Generally rich people purchase those goods for the sake of prestige. Hence rich people may buy more such goods when their prices rise.
3) Speculation:
When the price of a commodity rises the group of speculators expect that it will rise still further. Therefore, they buy more of that commodity. If they expect that there is a fall in price, the demand may not expand. Ex Shares in the stock market.
4) Illusion:
Some times, consumer develop to false idea that a high priced good will have a better quality instead of low priced good. If the price of such good falls, demand decreases, which is contrary to the law of demand.
Question 10.
What are the factors that determine the demand?
Answer:
The functional relationship between the demand for a commodity and its various determinants may be explained mathematically in terms of a demand function.
Dx = f(Px ,P1 ,……Pn ,Y,T)
Where
Dx = Demand for good X;
Px = price of X;
P1 …. Pn = Prices of substitutes and complementaries
Y = Income,
T = Taste of the consumer.
Determinants of demand :
1) Price of commodity:
The demand for any good depends on its price, more will be demanded at lower price and vice-versa.
2) Prices of substitutes and complementaries: Demand is influenced by changes in price of related goods either substitutes or complementary goods. Ex : Increase in the price of coffee leads an increase in the demand for tea in the case of substitutes positive relation and complementaries negative relationship between price and demand.
3) Income of the consumer: Demand always changes with a change in the incomes of the people. When income increases the demand for several commodities increases and vice-versa.
4) Population: A change in the size and composition of popu¬lation will effect the demand for certain goods like food grains, clothes etc.
5) Taste and preferences: A change in the taste and the fashions bring about a change in the demand for a commodity.
6) Technological changes: Due to economic progress tech-nological changes the quantity the quality of goods available to the consumers increase. Ex: Demand for cell phones reduced the demand for landline phones.
7) Change in the weather: Demand for commodity may change due to change in a climatic condition.
Ex : During summer demand for cool drinks, in winter demand for wollen clothes.
8) State of business : During the period of prosperity demand for commodities will expand and during depression demand will contract.
![]()
Question 11.
Explain the concept of Quasi Rent.
Answer:
Quasi Rent: The concept of quasi rent was first introduced in economics by Alfred Marshall. According to Marshall, quasi rent is the “income derived from machines and other appliances made by man
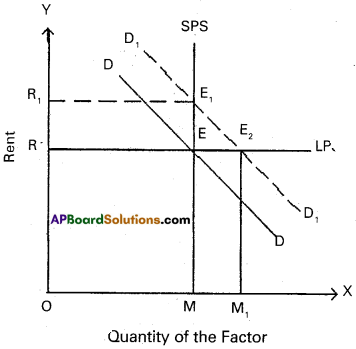
There are some machines and man made apppliances whose supply is inelastic in the short run. if the demand for these factors increases, their supply being fixed, they earn a surplus which is not rent but like rent. Marshall called it as quasi rent.
In fig., man made appliances are shown on OX-axis and rent is shown in OY-axis. LPS is the short period supply, LPS is the long period
supply. Initially equilibrium is at E. When demand increases, equilibrium shifts to Ej and quasi rent arises i.e. RRr per unit. It is observed that in the long run rent will disappear.
For example, when there is a large increase in demand for fish during a season, the demand for boats and nets will increase. The supply of these factors can not be increased immediately. So, they will earn extra price over and above the normal price. The extra income of the factors will disappear in the long run.
Question 12.
What are the factors that determine National Income?
Answer:
National Income is the total market value of all goods and services produced in a country during a given period of time. There are many factors that influence and determine the size of national income country.
a) Natural resources: The availability of natural resources in a country, its climatic conditions, geographical features, fertility of soil, mines and fuel resources etc., influence the size of National Income.
b) Quality and Quantity of factors of production: The national income of a country is largely influenced by the quality and quantity of a country’s stock of factors of production.
c) State of technology:
Output and national income are in-fluenced by the level of technical progress achieved by the country. Advanced techniques of production help in optimum utilization of a country’s national resources.
Question 13.
“Supply creates its own demand” comment on the statement.
Answer:
Classical theory of employment or the theory of output and employment developed by economists such as Adam Smith, David Ricardo, Robert Malthas etc., it is based on the J.B Say’s law of market. According to this law “supply creates its own demand”. The classical theory of employment assumes that there is always full employment of labour and other resources.
According to this law the supply always equals to demand it can be expressed as S = D. Whenever additional output is produced in the economy. The factors of production which participate in the process of production. Earn income in the form of rent, wages, interest and profits. The total income so generated is equivalent to the total value of the additional output produced. Such income creates addition demand necessary for the sale of the additional output. Therefore the question of addition output not being sold does not arise.
Question 14.
What are the sources of public revenue?
Answer:
Revenue received by the government from different sources is called public revenue. Public revenue is classified into two kinds.
1) Tax revenue
2. Non-Tax revenue.
1) Tax Revenue: Revenue received through collection of taxes from the public is called tax revenue. Both the state and centra government collect taxes as per their allocation in the constitution Taxes are.two types,
a) Direct taxes:
i) Taxes on income and expenditure. Ex : Income tax, Corporate tax etc.
ii) Taxes on property and capital assests.
Ex : Wealth tax, Gift tax etc.
b) Indirect taxes : Taxes levied on goods and services.
Ex : Excise duty, Service tax.
2) Non – tax revenue: Government receives revenue from sources other than taxes and such revenue is called non-tax revenue. They are
a) Administrative revenue:
Government receives money for certain administrative services. Ex : License fee, Tution fee etc.
b) Commercial revenue:
Modem governments establish public sector units to manufacture certain goods and offer certain services. The goods and services are exchanged for the price. So such units earn revenue by way of selling their products. Ex : Indian Oil Corporation, Bharath Sanchar Nigam Ltd, Bharath Heavy Electricals, Indian Railways, State Road Transport Corporations, Indian Air lines etc.
c) Loans and advances:
When the revenue received by the government from taxes and from the above non-tax sources is not sufficient to meet the needs of government expenditure, it may receive loans from the financial institutions operating within the country and also from the public. Modem government also taken loans from international financial institutions.
d) Grants-in-aid:
Grants are amount received without any condition of repayment. They are not repaid.
These are two types. 1. General grant, 2. Specific grant.
Question 15.
State the types of inflation.
Answer:
Inflation we mean a general rise in the prices in the ordinary language it is rapid upward movement of prices in a broader sense. The term inflation refers to persistent rise in the general price level over a long period of time.
According to Prof.Hawtrey: “Issue of too much currency”
According to ‘Dalton’: Defined inflation as “Too much Money is chasing too few goods”.
According to ’Pigou’: “Inflation exists when money income is expanding more than in proportion to increase in earning activity”.
According to Irving Fisher: “Inflation occurs when the volume of money increases faster than the available supply of goods”.
According to Samuelson: “Inflation denotes a rise in the general level of prices”.
Types of Inflation:
- Creeping inflation: When rise in the prices is very slow and small, it is called creeping inflation.
- Walking inflation: This is the second stage of inflation. The inflation rate will be between 2% and 4%.
- Running inflation: When the rate of inflation is in the range of 4-10% per annum, it is called running inflation.
- Galloping inflation or hyper inflation: If the inflation rate exceeds 10%, galloping inflation occurs. It may also called hyper inflation.
Question 16.
State the objectives of the Central Bank.
Answer:
Central Bank is the apex institution of the banking system in a country. It controls, regulates and supervises the activities of the country’s banking system. The Reserve Bank of India works to achieve the following objectives:
a) Regulating the issue of currency notes.
b) Achieving the monetary stability in the economy.
c) Controlling the credit system.
d) Providing guidance to commercial banks.
e) Evolving and implementing uniform credit policy through out country.
![]()
Question 17.
Explain the importance of Statistics.
Answer:
There is close relationship between statistics and economics. In the words of Tugwell “The science of economics is becoming statistical in its method”. All the economic laws are pronounced on the basis of statistical facts and figures. The theory of population of Malthus, law of family expenditure of Engels etc., were propounded after statistical tests. Statistics helps the economics to become an exact science.
In the study of theoretical economics, the application and use of statistical methods are of great importance. Most of the doctrines of economics are based on the study of a large number of units and their analysis. This is done through statistical methods. Law of demand was formulated because of statistical methods. The importance statistics is felt in all branches of knowledge in accountancy and auditing in banking, in insurance in research and many fields. Without statistics no branch of knowledge is complete.
Section – C
Note : Answer ANY EIGHT out of the following twelve question (15 × 2 = 30)
Question 18.
Intermediary goods.
Answer:
Goods which are under the process of production and semi finished goods are known as intermediary goods. Ex : cotton and fibre etc.
Question 19.
Price.
Answer:
The price of anything is its value measured in terms of money. Ex : A commodity is exchanged for 50 rupees then the price of commodity is 50 rupees.
Question 20.
Cardinal utility.
Answer:
Alfred Marshall developed cardinal utility analysis. According to this analysis the utilities derived from consumption of different commodities can be measured in terms of arbitary units called utils. 1, 2, 3, 4 are called cardinal numbers.
Question 21.
Demand Schedule.
Answer:
It explains the relationship between various quantities purcha¬sed at various prices by a consumer in the market. This can be explained as follows
| Price (Rs.) | Demand (Kgs) |
| 1 | 50 |
| 2 | 40 |
| 3 | 30 |
| 4 | 20 |
| 5 | 10 |
Question 22.
Income demand.
Answer:
It shows the direct relationship between the income of the consumer and quantity demanded when the other factors remain constant. There is direct relationship between income and demand for superior goods. Inverse relationship between income and demand for inferior goods. Dx = f(Y)
Question 23.
Marginal cost
Answer:
Marginal cost (MC) is the addition made to the total cost by the production of additional units of output. It is the change in total cost associated with a change in output. We can therefore, write MC = Change in Total Cost/Change in Output or MCn = TCn – TCn-1
Question 24.
Price discrimination.
Answer:
Monopolist will charge different prices for the same commodity or service in the market. This is known as discriminating monopoly or price discrimination.
![]()
Question 25.
Selling costs.
Answer:
An important feature of monopolistic market is every firm makes expenditure to sell more output. Advertisements through newspapers, journals, electronic media etc., these methods are used to attract more consumers by each firm.
Question 26.
Scarcity rent.
Answer:
Prof. Marshall explained the concept of scarcity rent on the basis of demand and supply. Scarcity rent is the surplus earned by land which has inelastic supply. In general land has indirect demand or derived demand. If there is an explosion of population, demand for land increases resulting in a
rise in its price. The surplus earned by land above its price is called scarcity rent.
Question 27.
Net interest.
Answer:
Net interest is the reward for the service of the capital loan. Ex: Net interest paid on government bonds and government loAnswer:
Question 28.
Percapita income.
Answer:
National Income when divided by country’s population, percapita income is obtained.
Percapita Income = \(\frac{National Income}{\sqrt{Total Population}}\)
The average standard of living of country is indicated by per capita income.
Question 29.
Full employment.
Answer:
Full employment is a situation in which all those who are willing to work at the existing wage rate are engaged in work.
Question 30.
Fiscal deficit.
Answer:
Fiscal deficit is the difference between total revenue and total expenditure plus the market borrowings. Fiscal deficit = (Total revenue – total expenditure) + Other borro¬wing and pther liabilities.
Question 31.
Overdraft.
Answer:
It means allowing the depositor to overdraw his account upto a previous agreed limit, banks allow overdrafts only to those persons who have their accounts in the bank. The overdraft is granted only for short period for customers.
![]()
Question 32.
Near money.
Answer:
The near money refers to those highly liquid assets which are not accepted as money but then can be easily converted into money within a short period. Ex : Saving bank deposit, shares, treasury bills, bonds etc.
Question 33.
Currency.
Answer:
Currency is the form in which money is circulated in the economy by the monetary authority i.e., the government and the central bank. Currency includes coins and paper notes. It is only one component pf money. Money comprises of not only currency but demand deposit and time deposits also.
Question 34.
Liquidity.
Answer:
Money is the most important liquid Asset. Interms of liquidity, it is superior other assets. Money is centpercent liquid.
Question 35.
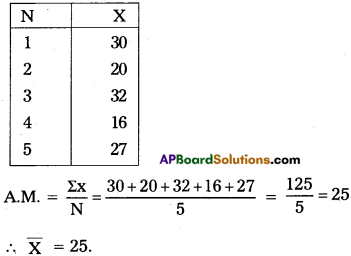
Find the A.M. of data 30, 20, 32, 16, 27.
Answer:
Question 36.
Find the Mode for the data : 10, 27, 24, 12, 27, 27, 20, 27, 15, 27
Answer:
By the data the no. of times repeated variable is ’27’. Hence the mode for the given data is 27.
∴ z = 27
Question 37.
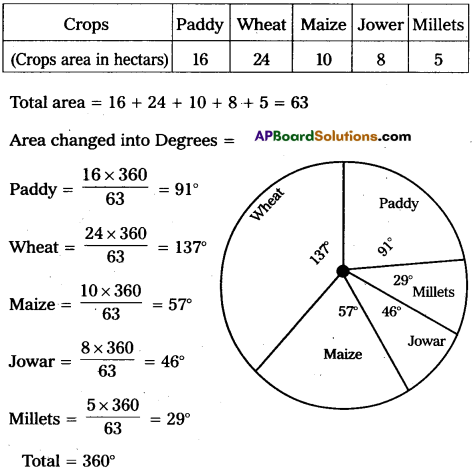
Answer:
This diagram enables us to show the partitioning of total into component parts. It is also called a pie chart. Ex : Draw the pie diagram for following data.