Thoroughly analyzing AP Inter 2nd Year Economics Model Papers Set 4 helps students identify their strengths and weaknesses.
AP Inter 2nd Year Economics Model Paper Set 4 with Solutions
Time: 3 Hours
Maximum Marks: 100
Section – A (3 × 10 = 30)
Note :
- Answer any THREE of the following questions in 40 lines each.
- Each question carries 10 marks.
Question 1.
Explain the features of developing countries.
Answer:
Developing economies are distinguished from developed economies on the basis of their per capita income. Most of the economies are agarian in nature and their present rate of capital formation is low and inadequate to meet the requirements of their development.
According to United Nations “The countries which have real per capita income less than a quarter of the per capita income of the United States are developing countries”.
The following are the characteristic features of developing countries with special reference to India.
1) Low per capita income : One of the basic features of developing countries is low per capita income. The low income and middle income countries combined together are called developing countries.
The per capita G.N.I. of India has increased from $ 1,070 to $ 1,530 (2011) entered into the group of lower middle income countries.
2) Scarcity of capital: The rate of capital formation is low in most of the developing countries. In the most of developing countries the saving rates range between 15 to 20%.
According to C.S.O estimates the growth of gross domestic saving was 27.9% and capital formation was 24% in the year 2011 – ’12.
3) Unemployment: Wide spread unemployment is one of the important features of developing countries. In India unemployment is due to the deficiency of capital. There is disguised unemployment in rural areas. Around 60% of the population is depending on agriculture for .employment. The planning commission estimated that there was a back log of 37 million unemployed at the beginning of 11th plan and it was expected that 82 million by the end of the plan.
4) Demographic characteristics : The developing countries are facing the problem of heavy population. They are successfully reducing the mortality rates by improving the medical facilities but failed to control the birth rates, this led to population explosion. India is also facing the problem of heavy population. It’s population was 1210 million in 2011 and it increased to 1278 million in 2015.
5) Predominance of agriculture : One of the basic features of developing countries is that they are predominantly agrarian economies. The share of agriculture in G.D.P is between 20 to 30%.
According to Indian economic survey 2013 – 14, 54.6% of the working population is engaged in the agriculture sector and it contributes 13.9% of the G.D.P.
6) High incidence of poverty: The another important feature of developing countries is the prevalence of mass poverty. The people in these countries suffer from low level of income, malnutrition, ill health and illiteracy.
India is also facing the problem of poverty. As per Tendulkar committee reports, the planning commission has updated the poverty line. Based on this; The percentage of population living below the poverty line was 29.8% in 2009 – ’10.
7) Income inequalities : The most important feature of developing economies is the disparities in income and wealth. Compared to the developed countries, the income inequalities are larger in the developing countries.
According to 68th round of NSSO for the year 2011 -12 the monthly per capita consumption expenditure of the poorest 10% of the rural population rise by 11.5% in 2011 -12 compared with the 66th round for the year 2009 -10. In urban areas, the growth was 17.2% and 30.2% respectively over the same period.
8) High density of population : The density of population is very high in the developing countries due to the large size of population. The density of population of the world was 50 per sq.km in 2011. It is in India was 382 per sq.km in 2011, where it was 3 in Australia, 33 in USA, 145 in China etc.
9) Low quality of life : The quality of life in the developing countries is very low in comparison with developed countries. These countries people suffer from malnutrition, high population, safe drinking water and lack of sanitation etc. The life expectancy at birth is below 65 years.
10) Technical backwardness : In the developing countries the production techniques are backward due to lack of research and development. These countries use labour intensive technique because high population and capital deficiency.
Indian economy is also technically backward. Modem and traditional techniques are used side by side in different sectors of the economy. It has affected the productivity in the economy.
11) Dual economy : Economists talk of various types of dualism existing in developing economies.
They are
(a) Social dualism
(b) Technological dualism
(c) Financial dualism.
Indian economy also characterised by the dualism, the product and factor markets in India are divided with different degree of imperfections. Technological dualism is existed in India. There prevailed two kinds of economic sectors i.e., organised and unorganised sectors. The industrial sector uses the modern technology and agriculture sector still follows old method of production.
12) Price instability: The price instability is also basic feature of the developing countries. In India there is continuous price instability because of shortage of essential commodities and gap between consumption and production.
![]()
Question 2.
What are the different indexes to measure Human Devel-opment ?
Answer:
Human Development Index : In recent years the search for an alternative to GNP as a measure of economic development has led to computation of the Human Development Index (HDI). The United Nations Development Programme (UNDP) introduced the HDI in its first Human Development Report prepared under the able stewardship of Mohbub UI Haq and published in 1990. The measure has been enlarged and refined over the years and many related indices of human development like Gender Related Development Index (GDI), Gender Empowerment Measure (GEM) and Human Poverty Index (HPI), Gender Inequality Index (GII), Multidimensional Poverty Index (MPI) have been developed in subsequent human development reports published annually by UNDP.
- A longevity of life is measured in terms of life expectancy at birth.
- Knowledge is measured interms of education.
- A standard of living is measured in terms of GDP percapita (PPPUS$).
Human Development Index measures the average achievement in three basic dimensions of Human Development.
Before calculating HDI, an index for each of three dimensions is calculated. For this purpose, maximum and minimum values are chosen for each indicator.
Maximum and Minimum values for calculation of HDI.
| Indicator | Maximum value | Minimum value |
| 1. Life expectancy at birth | 83.6 years | 20 years |
| 2. Adult literacy rate | 100 | 0 |
| 3. Gross enrollment ratio | 100 | 0 |
| 4. GDP percapita (PPPUSD) | 87478 | 100 |
Performance in each dimension is expressed as a value between 0 and 1 by applying the following formula.
HDI = [later]\frac{\text { Actual value }- \text { Minimum value }}{\text { Maximum value }- \text { Minimum value }}[/latex]
HDI report 2014 has classified the selected countries into four categories.
- Countries with the HDI value of 0.8 and above are grouped as the Very High Human Development Countries.
- Countries with the HDI value ranging from 0.7 to 0.8 are grouped as High Human Development Countries.
- Countries with the HDI value ranging from 0.5 to 0.7 are grouped as Medium Human Development Countries.
- Countries with the HDI values of less than 0.5 are in the Low Human Development Countries. India has improved its HDI index from 0.42 in 1980 to 0.554 in 2012.
- India was ranked among 177 countries improved from 138 in 1994 to 128 in 2005, but now it has declined to 132 in 2007, 134 in 2008, 136 among 187 countries in latest report 2013.
Gender Related Development Index (GDI) : While HDI measures average achievement, the GDI adjusts the average achievement to reflect the inequalities between men and women, the three components used for the purpose are
- Female life expectancy.
- Female adult literacy and gross enrolment ratio.
- Female percapita income.
If gender inequalities did not exists, the value of GDI and HDI would be the same, but if the gender inequality exists, the value of GDI would be lower than that of HDI. The greater the difference between HDI and GDI, the more in the inequality.
Gender Empowerment Measure (GEM) : The Gender Empowerment Measure was also introduced by the human development report 1995. The GEM indicates whether women are able to actively participate in economic and political life. It focuses on participation, measuring gender inequality in key areas of economic and political participation and decision making. There- are three components, which are used for measuring GEM.
- Participation of women in economic and political activities.
- Gender inequality in economic and political participation.
- Female empowerment.
Human Poverty Index (HPI) : The human development report 1997 introduced the human poverty index, which concentrates on deprivation in three essential elements of human life already reflected in HDI longevity knowledge and a decent living standard.
Question 3.
Explain the factors responsible for “Green Revolution” in India and its impact on Indian economy.
Answer:
The Government of India has announced the New Agricultural Strategy in 1965 to ensure rapid agricultural progress. Prof. Norman Borlog is the father of green revolution. The new strategy of agriculture which resulted in revolutionary progress in the farm sector during the period 1960 – 70 is termed as Green Revolution. Willian S. Gand is the first economist who used the term green revolution.
Achieving high produce and productivity in farm sector by implementing hybrid seeds, fertilizers, pesticides, machines etc., and also by inducing farmers is called green revolution.
Factors responsible for Green Revolution :
1. Intensive Agriculture District Programme (IADP) : In 1964 Government of India has introduced this programme on the basis of recommendation of Ford Foundation Team. This programme was introduced in Seven Districts like West Godavari in Andhra Pradesh, Shahabad in Bihar, Raipur in Madhya Pradesh, Thanjavur in Tamilnadu, Ludhiana in Punjab, Aligarh in Uttar Pradesh and Pali in’Rajasthan where assured irrigation facilities, high fertility, proper rainfall and less hazards (like floods, drainage problem, soil conservation problem etc) are available.
2. Intensive Agricultural Area Programme (IAAP) : In 1967, Government of India has introduced this programme with a view to extend the area under intensive cultivation. Under this programme intensive cultivation has extended to other districts of various states. Both the programmes IADP and IAAP are restricted to the intensive cultivation of selected regions but IAAP is limited to some crops only. As a result of intensive cultivation in the selected regions, the neighboring districts will also develop which is treated as spread effect. This programme had extended to 164 Districts in the country.
3. High Yielding Variety Programme (HYVP) : In the new farm technology high yielding variety of seeds programme is crucial because it enables the Indian Agriculture to ensure high productivity. Hence, Government of India initiated the programme in 1965.
Various types of hybrid, seeds are innovated with collective efforts of Indian Council of Agricultural Research (ICAR), International Crops Research Institute for Semi-Arid Tropic, (ICRISAT), Universities in Punjab and other research institutes. As a result of HYVP remarkable rise in the production of paddy, wheat, sugarcane, cotton etc., has taken place.
4. Introduction of crops with short gestation period : Various crops with short gestation period have been developed in India with the continuous collective research of various organizations like ICAR, ICRISAT. Considerable decrease has taken place in the gestation period of paddy, wheat, maize etc. Some kinds of paddy like IR 8, IR 20, 1001, 1010, Masuri, Basmati, Jaya, Padma etc., and mexican type of wheat known as miracle wheat which have short gestation period are being produced by Indian farmers.
5. Expansion of Irrigation Facilities : Agriculture research and experiments take place only in those areas where proper irrigation facilities are available. So far all the high yielding variety seeds require more irrigation facilities. The area under the irrigation facilities increased from 21 million hectares in 1951 to 63 million hectares by 2010.
6. Farm Mechanization : Mechanization is an integral part of green revolution. Mechanization in the farm of sector in the form of tractors, oil engines, electric motors, crushers, drillers, harvesting machines etc., enriches the operations in agriculture. As agricultural operations are being seasonal, mechanization is essential for timely operations in agriculture.
7. Consumption of fertilizers and pesticides : High yielding variety seeds are highly responsive to the use of fertilizers and pesticides. In order to achieve high production by using fertilizers and pesticides the Government of India has been providing subsidies favorably affects productivity of agriculture.
8. Other Factors:
a) Agricultural Extension Services centers like “Rural Knowledge Centers”, “Agricultural Technology Management Agency” (ATMA) etc, are established by the Government of India.
b) Adult education centers have been established by the Government to literate the rural people.
c) Credit facilities are indispensible for the successful accomplishment of timely operations in agriculture. The Government of India has been providing credit to the peasants through Commercial, Regional Rural banks, Primary Agricultural Co-operative Credit Societies etc.
Impact of Green Revolutiomtm Indian Economy :
1. Increase in Foodgrain production : The rice production from 35.0 mts in 1960 – 61 increased to 99.37 mts in 2008 – 09. The production of wheat was 11.0 mts and rose to 77.63 mts. The production of pulses was only 12.7 mts in 1960 – 61 which has increased to 14.2 mts. Totally production of food grains was 82.0 mts in 1960 – 61 and that has increased 229.9 mts by the year 2008 – 09.
2. Boost to employment generation : Green revolution is the small farm revolution. Labour intensive crops like rice, sugarcane, potato, vegetables, fruits have increased the employment opportunities in agriculture sector. The entry of corporate houses has generated more employment opportunities in retailing business of fruits and vegetables.
3. Improvement in incomes: The impact of green revolution revealed that the farmers in Kerala, Madhya Pradesh, Andhra Pradesh, Tamilnadu, Gujarat, Punjab and Himachal Pradesh had good chances of improving their incomes. It facilitates the farmers to follow simple but scientific and technical ways like grading the produce in the field itself selling directly to the corporate retail companies by avoiding middlemen. Organised retailers have provided better remunerations to the farmers. So the consumers were benefited in the form of quality produce at lower prices.
Therefore the green revolution has also widened the inequalities between big and small farmers in rural areas.
4. Forward and backward linkages strengthened : Agriculture supplies raw material to industries which is known as forward linkage. The new technology in agriculture has strengthened the backward linkage. This way the linkage between agriculture and industry has got strengthened.
5. Decrease in Poverty: The result of green revolution surplus in the production of food grains is actived.
![]()
Question 4.
Mention the various causes.for industrial backwardness in India.
Answer:
India could not achieve the desired growth rate in the industrial sector even though it is rich in natural resources and has huge working population. Even after completion of eleven Five Year Plans, there is wide gap between targets fixed targets achieved. Rakesh Mohan opines that there is a gap of 20 percent on an average between the targets fixed and targets realized in each plan annually. The reasons for this are as follows.
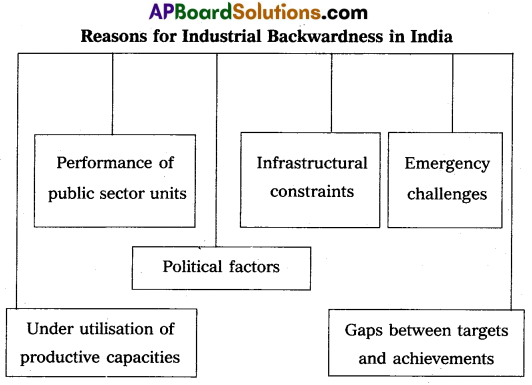
1) Under – utilisation of productive capacities : Many of the industrial units failed to utilize the existing productive capacities fully. There are many reasons for this. Among them is raw material scarcity, low technical know-how etc. For example during 2005 – 2006, out of 203 public sector enterprises, the capacity utilization was below 50 percent by nearly 67 percent of the units.
2) Performance of public sector units : Prior to liberalization, there was a phenomenal growth of the public sector.
Many of the public sector units were Tinder losses. The number of loss making units decreased from 105 in 1999 – 00 to only 63 in 2011. However, the losses increased from ₹ 10,302 crores in 1999 – 00 to ₹ 27,602 crores in 2011 – 12.
3) Political factors : In many situations, political factors influence decision about location of projects not considering feasibility. This approach leads to a considerable wastage of capital resources.
4) Infrastructural constraints: One of the major constraints in industrial development is poor quality and high cost of infrastructure particularly power and transport network. All such infrastructural constraints not only showed adverse effect on industrial growth but also reduced the competitiveness of Indian industries that were, fast emerging in the new global economic environment.
5) Gaps between targets and achievements : In the earlier period of planning achievements were below the targets. Rakesh Mohan has observed. “The average industrial growth rate achieved over thirty – five to forty years has been about 6.2 percent rate to the average of about 8 percent projected”.
6) Emergency challenges: As a founder member of the World Trade Orginization, India has withdrawn all quantitative restrictions on imports. This resulted into the closure of a nuclear of industrial units. Thus, the industrial sector facing so many problems.
Question 5.
Define tertiary sector. Explain the importance of tertiary sector in Indian economy.
Answer:
The tertiary sector activities include all other activities like transport communication, banking, insurance and trade. Tertiary sector with its sub-sectors act as complementary sector to the development of primary and secondary sectors. Economists argue that the development of the economy is associated with high proportion of grass domestic product and working population employed in tertiary sector. The importance of the tertiary sector can be illustrated by the following indices.
1) Share in the gross domestic product : A review of the sectoral contribution to the gross domestic product reveals that the contribution of service sector has been increasing from 1950, its share was 27.5 percent of the GDP in 1950 – 51 and increased to around 56.0 percent in 2007 – 2008. The share of services sector in India is continuously increasing. It was only 27.5 percent in 1950 – 51 and increased to 40.59 percent in 1990 – 91 and further to 55.73 percent in 2007 – 08. In 2013 it was 57.0%.
2) Workers employed : Generally there is a tendency for the tertiary .sector to expand more rapidly than secondary sector activities as a consequency the percentage of labour force engaged in this sector also registers an increase.
The workers engaged in tertiary sector has increased from 178.56 lakhs (1991) to 182.65 lakhs in 2008. Though 189.60 lakh workers were employed in tertiary sector during 2001 there was a decline in the number of workers employed to 182.65 lakhs in 2008. This was mainly due to the decline in the employment of workers in public sector.
It is evident form the data that 54.1 percent of the workers employed in tertiary sector are in rural areas and the proportion of urban areas was 45.9 percent.
3) Exports of services: India has been recording high growth in the export of services during the last few years. Exports of services was US $ 460 billion in 2004 – 05, increased to US $ 61.4 billion in 2005 – 06 and to US $ 90.1 billion in 2007 – 08 growth of exports was particularly repaid in the miscellaneous services which comprise software services, business services, financial services and communication services India’s export of services is expected to touch US $ 310.9 billion powered by the booming software consultancy, engineering and tourism sectors by 2011 – 12.
![]()
Section – B (8 × 5 = 40)
Note :
- Answer any EIGHT of the following questions in 20 lines each.
- Each question carries 5 marks.
Question 6.
Importance of Human Resource Development.
Answer:
Human resource development plays an important role in economic development. In fact, effective use of physical capital itself is dependent on human resources. This is due to the reason that if there is under investment in human resources the rate at which additional physical capital can be productively utilised will be limited since technical, professional and administrative people required to make effective use of material resources. Modem economists in recent times have pointed out that many third world countries have remained underdeveloped an account of underdevelopment of human resources.
Therefore, large scale investment in human resources are needed if physical capital available in these countries to be exploited more fully and in a more efficient way. It has also been observed that the development of human resources is intricately related to the process of the economic development. But proceed together and reinforce one another.
Question 7.
What is the role of Micro Finance in reducing the poverty in India?
Answer:
Micro Finance institutions in India exist as non-governmental organizations. A section of 25 companies and Non-Banking Financial Companies (NBFC’s) and Commercial banks, Regional Rural banks, Co-operative societies and other large lenders have played an important role in providing refinance facility to Micro Finance Institutions.
“Micro Finance is the provision of Financial services to low income clients or solidarity lending groups including consumers and self-employed, who rationally lack access to banking and related services”. It covers a wide range of services like credit, savings, insurance, remittance and also non-financial services like training and counciling.
Micro Finance and Poverty reduction :
1) As an intervention to allieviate poverty, micro finance is viewed as the practice of extending small loans and other financial services such as savings and insurance to the poor for empowering them to protect themselves from economic setbacks.
2) Poverty can also be understood as vulnerability to downward in income. Such fluctuations may results from unexpected shocks such as crop failure, illness, funeral expenses or loss of assets such as livestock through theft or death. Micro Finance are the promise to reduce such vulnerable and protect livelihoods also reduce poverty.
3) An important dimension of poverty is powerlessness. Powerlessness can be experienced in a variety of situations, within the households, as a result of differences in gender and age and within the community, between socio economic groups, as a result of cost, electricity and wealth. Intervention with micro finance can influence the power relations of the society by fastering salidarity among the vulnerable through its group-based mechanism.
4) In most parts of the country micro finance services are being provided through group based systems that are advantageous of using peer pressure as social collateral.
5) These group-based systems can be broadly classified into two systems. They are Grameen, Group system, pioneered in Bangladesh and Self Help Group (SHG) system, Nurtured in India. Both these systems are widely replicated all over the world.
6) With the globalization and liberalization of the economy, opportunities for the unskilled and illiterate are not increasing fast enough, as compared to the first of the economy. This leads to a lopsided growth in the economy thus increasing the gap between the rich and poor. It is in this context, the institutions involved in micro finance have a significant role to play to reduce this disparity and poverty.
Question 8.
Role of Reserve Bank of India in Rural Credit.
Answer:
RBI was established in 1935 and was nationalized in 1949. It has been rendering viable services for the development of rural areas. It has started agriculture credit department and two separate funds in 1956 to supply to the agriculture sector.
They are
- National Agriculture Credit Fund,
- National Agricultural Credit Stabilization Fund.
R.B.I provides credit to the farmers through State co-operative banks in the following ways.
a) Short Term Credit : RBI provides short term credit facilities to State co-operative banks at a lower interest rate for a period of 15 months by providing rediscounting facilities on Govt, securities and debentures of land development bank.
b) Medium Term Credit : R.B.I has been providing medium term credit to the State co-operative banks for a period of 15 months to 5 years.
c) Long term Credit : R.B.I provides long term credit to the State Govt, for agricultural development activities. The term credit varies from 5 years to 20 years.
Other services:
- It provides credit to all the institutions which are engaged in rural credit.
- It provides loans for small farmers development agency and marginal farmers development agency.
![]()
Question 9.
Various stages of agricultural marketing.
Answer:
Farms cannot sell away all the their products instaniously after harvesting. These products must go through a series of stages before they are actually marketed. Such stages in agricultural marketing.
- Assembling : The total produce of various farmers from various places should be brought to one place. The process of pooling up of small surpluses of individual farmers in the market of the producing area is called assembling.
- Transportation : All the farm products must be transported from the producer markets to consumer markets. Transportation facilitates the availability of goods in the market.
- Grading : All the assembled products should be graded and standardized according to their quality and durability.
- Processing : All the agricultural products assembled and graded cannot be used directly. So those products should be made useful for consumption.
- Sampling : Samples are to be made from the graded, standardized and processed produce. This sampling process enables the consumer to choose the best goods from the market.
- Packing : All the farms products whether processed or not must be packed to ensure better quality.
- Storing : All the farms products processed and packed cannot be sold immediately. They have to be preserved in store houses until they are sold.
Question 10.
Objectives of National Manufacturing Policy.
Answer:
Government of India brings back industrial policy into focus in the form of National manufacturing policy on November 4th 2011.
Objects :
- Increase manufacturing sector growth to 12 – 14% over the medium term.
- Create 100 million additional jobs in the manufacturing sector by 2012.
- Increase the share of manufacturing in gross domestic product from 16% to 25% by 2022.
- Create appropriate skills among the rural and urban migrant.
- Increase domestic value addition and technological depth in manufacturing.
- Enhance global competitiveness of Indian manufacturing.
Question 11.
Special Economic zones.
Answer:
Special Economic Zones policy ,was announced by Government of India in April 2000. This policy aims at rapid economic growth by quality infrastructure complemented by an attractive fiscal package, both at the Central and State level. In India, while passing the SEZ Act in May 2005. It came into effect from February 2006.
Objectives :
- Development of infrastructure facilities.
- Generation of additional economic activity.
- Promotion of exports of goods and services.
- Promotion of investment from domestic and foreign sources.
- Creation of employment opportunities etc.
Question 12.
What are the major constituents of insurance industry in India?
Answer:
A Health and Development Insurance Sector of vital importance to every modem economy. It encourages the savings habits provides a safety net to rural and urban enterprises and individuals and generates long term funds for infrastructure development. Development and insurance is therefore, necessary to support continued economic growth social security and person reforms also benefit from a mature insurance industry.
There are two major constituents of Insurance :
1) Life Insurance
2) Non Life Insurance (General)
1) Life Insurance : LIC offers schemes, policies and plans to investors. Particularly the main objective of LIC is giving protecting against risk of death and channalizing the funds for the benefits and the economy in the socially oriented sectors during 2013 – 14.
Life Insurance underwrote first – year premium of ₹ 1,19,641 crore as against ₹ 1,07,361 crore during 2012 – 13 registering a growth of 11.44 percent.
2) Non Life Insurance (General) : The general insurance companies deal with non life insurance. The GIC was approved as the Indian Reinsurer on 3rd November 2000. It offers fire, marine, motor, health and other insurance. During 2013 – 14, non-life insurance including stand lone health insurance and specialize insurance (Export Credit Guarantee Scheme) and Agriculture Insurance Company (AIC) underwrote premium worth ₹ 77,584 crore as against ₹ 69,089 crore during 2012 -13 registering a growth of 12.23 percent.
![]()
Question 13.
Explain atleast three failures of plans.
Answer:
The Indian economy has made significant progress over more than sixty five years of planning era. Still there are many weaknesses which point out towards the failures of Indian plans in many ways. Some of the failures are presented as under.
a) Despite more than sixty years of planned economic development, still there exist the problems of poverty and unemployment. In 2012 the Indian government stated 21.9 percent of its population is below its official poverty limit. (About 300 million people), like wise the from 1983 till 2011 unemployment rates in India averaged 9 percent reaching an all time low of 3.8 percent in December 2011. The NSS data reveals the number of unemployed to be of the order of 26.58 million during 1999 – 2000 and 28.1 million during 2009 – 10.
b) Inspite of the several measures taken under land reforms, still there exist inequalities regarding land, income and wealth. Distribution of surplus lands not completed.
c) One of the objectives of Indian Five Years Plans was to establish an egalitarian society. This could not be achieved so far.
d) The plans are not able to control the volume of black money and corruption. In Feb 2012 Central Bureau of Investigation (CBI) said that Indian have $ 500 billion illegal money (Black money) based on a statement made to India’s Supreme Court in July 2011.
e) We still have to go a long way to reach the target of Health to All.
Question 14.
Explain various concepts of Environment.
Answer:
Environment around us consists of living and non living things with their inter dependency and mutual interaction. A study of all these aspects is called as ecology. To understand environment and its nature, a primary information of its basic concepts is needed. Eco-system biodiversity, greenhouse effects, global warming, climate change, acid rains, ozone depletion are some of the basic concepts of environment.
A) Eco-System : The British Ecologist A.G.Tansley coined the term Ecosystem in 1935. An ecosystem is a region with a specific and recognizable land, scape (form) such as forest, grassland, desert, or coastal area. The living community of plants and animals in any area together with the non-living components of the Environment constitute as ecosystem.
B) Biodiversity: The word biodiversity was coined by Walter Rosen in 1986, Living organisms are different in their size, colour, shape and structure. The genes, environment and ecosystem decide this variety and complexity in the living organisms. The variety and variability among living organisms is called as biodiversity.
C) Greenhouse effect : It is a phenomenon in which the atmosphere of a planet traps radiation emitted by the sun, caused by gases such as carbon dioxide, water vapour and methane that allow incoming sunlight to pass through but retain heat radiated back from the planet’s surface. It is a process by which thermal radiation from a planetary surface is absorbed by atmospheric greenhouse gases and is re-radiated in all directions.
Greenhouse effect may leads to many serious environmental issues such as radiation, climate change, mansoon, directions and its efficiency and so on.
D) Global Warming : Global warming is the increase of Earth’s average surface temperature due to the effect of greenhouse gases, such as carbon dioxide emissions from burning fossil fuels or from deforestation. Which trap heat that would otherwise escape from Earth.
E) Acid Rain: Acid rain is a broad term referring to a mixture of wet and dries deposition (deposited material) from the atmosphere containing higher than, normal amounts of nitric and sulfuric acids. These acid rains are the result from both natural sources such as volcanoes and decaying vegetation and man-made sources, primarily emissions of sulphur dioxide (SO2) and nitrogen oxides (N2O) resulting from fossil fuel combustion.
F) Ozone Depletion: Reduction in the amount of Ozone (O3) in the stratosphere is called ozone depletion. It happens due to high levels of chlorine and bromine compounds in that layer.
As ozone depletes more ultraviolet (UV) radiation comes to earth and causes damages to all living organisms. UV radiation seems responsible for skin cancer and other skin complications.
Question 15.
Measures for the conservation of forests.
Answer:
Forests are the carbon sinks and treasures of scenic beauty. The following are some protective measures such important forests.
- Forest land should not be alloted to poor for house sites.
- Specific areas must be developed under social forestry programmes.
- Waste land must be brought under plantations.
- Forest must be protected from fires particularly m summer.
- Measures must be taken to refill the depleted forest area.
- Establishment of Joint Forest Management Communities is necessary
- Cattle grazing and illegal cutting of trees should not be allowed.
- Local communities must be involved in the conservation of forests.
![]()
Question 16.
Population characteristics of Andhra Pradesh.
Answer:
The demographic characteristics of newly formed State of Andhra Pradesh with 13 districts (Coastal Andhra & Rayalaseema). The population of 4.96 crore which accounts for 4.1% of the country’s population makes it-the 10th most popular state in the Country of this male are 2,48,30,513. A female population is 2,47,46,950 in 2011 census. Sex ratio for every 1000 male is 997 and female is 943 in 2011. Where the rural population is 349.67 in 2011, in total population the density of population goes up 304 per sq.km in 2011 census. The fertility rate in A.P is also showing a downward trend in the recent years. The literacy rate is 67.35 in 2011 for A.P in which male literacy is 74.77 and that of female is 59.96. State has 5.64% less literates when compare to the Nation.
Question 17.
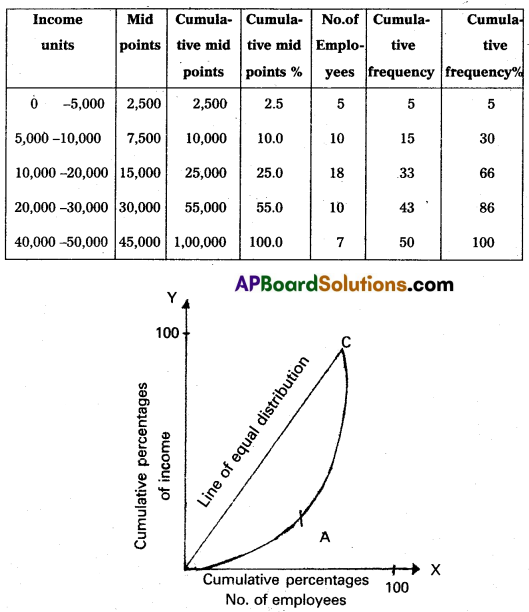
Define Lorenz Curve. When is it used ?
Answer:
This-curve was given by Dr. Max.O.Lorenz, a popular Economic statistician. He studied distribution of wealth and income with its help. It is graphic method to study dispersion. It helps in studying the variability in different components of distribution. The base of Lorenz curve is that we take cumulative percentage along X & Y axis. Joining these points we get the Lorenz curve.
Lorenz curve uses the information expressed in a cumulative manner to indicate the degree of variability.
For example : The monthly incomes of employees of a company given below.
| Income | Number of employees |
| 0 – 5,000 | 5 |
| 5,000 | 10 |
| 10,000 – 20,000 | 18 |
| 20,000 – 40,000 | 10 |
| 40,000 – 50,000 | 7 |
Solution:
Section – C (15 × 2 = 30)
Note :
- Answer any FIFTEEN of the following questions in 5 lines each.
- Each question carries 2 marks.
Question 18.
Human capital.
Answer:
Expenditure on education, training, skill formation research and improvement in health is called human capital.
Question 19.
Great dividing year of population.
Answer:
The year 1921 is regarded as great dividing year of population because both birth and death rates were high before 1921, later death rate has been decreasing more rapidly than birth rate in India.
Question 20.
Relative poverty.
Answer:
The people with lower income are relatively poor compared with higher incomes, eventhough they may be living above the minimum level of subsistance is called relative poverty.
Question 21.
Disguised unemployment.
Answer:
A person whose marginal productivity is zero or when more people are engaged in a job than actually required.
![]()
Question 22.
Agro based industries.
Answer:
Industries which depend on agriculture products for their raw materials are called agro based industries. Ex: Cotton, textile, flour mills, sugar etc., directly depend on agriculture for raw materials.
Question 23.
AGMARK
Answer:
It is simply an abbreviation for agriculture marketing which is the symbol of quality of produce.
Question 24.
MRTP Act.
Answer:
Monoploy Restrictive Trade Pratices Act. The Act will concentrate more on controlling unfair or restrictive trade practices.
Question 25.
ICICI.
Answer:
Industrial Credit and Investment Corporation India. It was set up in January 1955 and it commenced business in March of the same year. It was second all Indla.development financial institution to be established in the country. It was a private sector development financial institution.
Question 26.
Infrastructure.
Answer:
An umbrella term for service activities in the economy. Infrastructure is categorized into two groups. They are economic infrastructure and social infrastructure.
Question 27.
Civil Aviation.
Answer:
Air transport has a vital role in the economic development of the country. It is the modem and quickest transport. In India the first commercial flight started on February 18th, 1911. The real progress in civil aviation started in 1920.
Question 28.
Land Degradation.
Answer:
Land is a valuable resource wedepend for food, habitations and for all the basic necessities on land. The land is said to be degraded. Deforestation, cultivation, industrialisation, wind erosion, soil acidity are important sources for land degradation.
![]()
Question 29.
Swachh Bharat Abhiyan.
Answer:
Mahatma Gandhi communicated a quintessential message to the ration through his efforts, to educate people around him about cleanliness. He wished to see a ‘Clean India’. To work seriously towards this vision of Gandhiji, R M. Shri Narendra Modi – External website that opens Swachh Bharat in October 2, 2014. This mission seeks to achieve the goal of clean India 150th birth anniversary of Bapu.
Question 30.
Any welfare programme.
Answer:
Government of A.P has been implemention various welfare programmes/schemes. Some of the welfare programmes are Pavala Vaddi scheme, Abhaya Hastam Ready to eat, Metric Scholarships, Micro credit to self help groups etc.
Question 31.
Annual plan.
Answer:
Annual plan is a part of five year plan. The targets of five year plans are divided into annual targets and detailed plans will be prepared year – wise.
For example : There was a plan holiday for three years from 1966 – 69 at that time annual plans are implemented by postponing the commencement of 4th plan.
Question 32.
W.T.O
Answer:
The WTO Agreement came into force from January 1, 1995. WTO is a new international organisation setup as a permanent body and is designed to play the role of a watch dog in the spheres of trade in goods, trade in services, foreign investment, intellectual property rights etc.
Question 33.
F.D.I.
Answer:
Investment in a foreign country where the investor remains control over the investment. FDI means foreign direct investment.
Question 34.
SIDBI
Answer:
Small Industries Development Bank of India with a view to ensure largest flow of financial and non financial assistance to the small scale and cottage industries. The SIDBI Act was passed by the parliment in 1989 and the bank commenced its operation from April 2nd 1990.
![]()
Question 35.
Mean deviation.
Answer:
Mean deviation also called as average deviation. It is the average difference between the items in a series from the mean or median or mode. In this mean deviation we ignored ± signs.
M.D = \(\frac{\Sigma \mathrm{f}|\mathrm{D}|}{\mathrm{N}}\)
Question 36.
Range,
Answer:
Range is the simplest method of studying dispersion. It is defined as the difference between the value of the smallest item and the value of the largest item included in the distribution.
Range = L – S
Where L = Largest item; S = Smallest item.
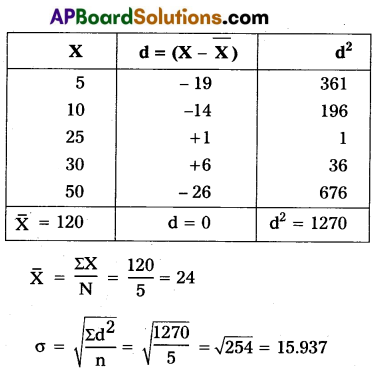
Question 37.
Calculate S.D of the following values
Solution: