Telangana SCERT TS 8th Class Physics Study Material Pdf 12th Lesson Graphs of Motion Textbook Questions and Answers.
TS 8th Class Physics 12th Lesson Questions and Answers – Graphs of Motion
Reflections on concepts
Question 1.
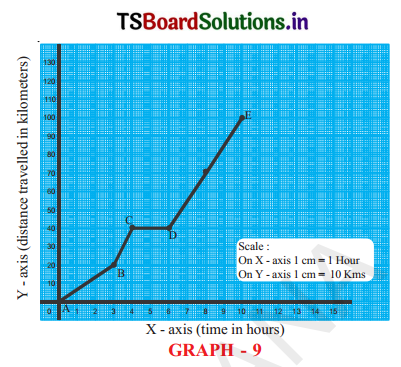
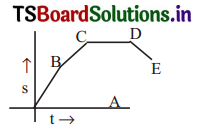
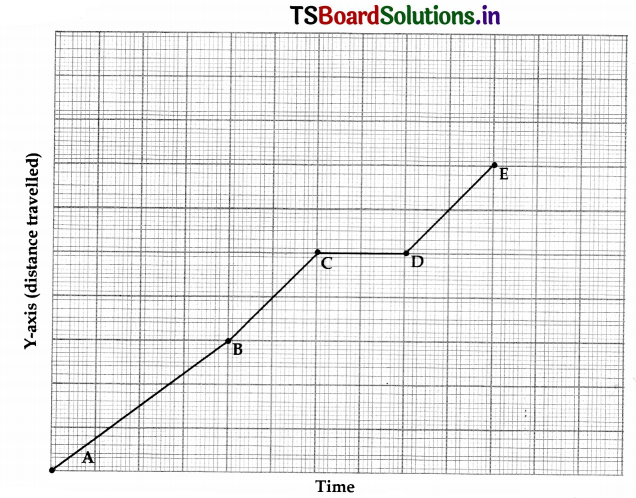
Look at graph 9. Which section of graph 9 has the greatest slope? What can you say about the speed in this section? What can you say about the speed in section CD of the graph.
Answer:
- The slope is more in the section ‘BC of graph.
- In this section the body is moving with greater or highest speed.
- In the “CD” section the body is at rest. Here slope is zero.
Application of concepts
Question 1.
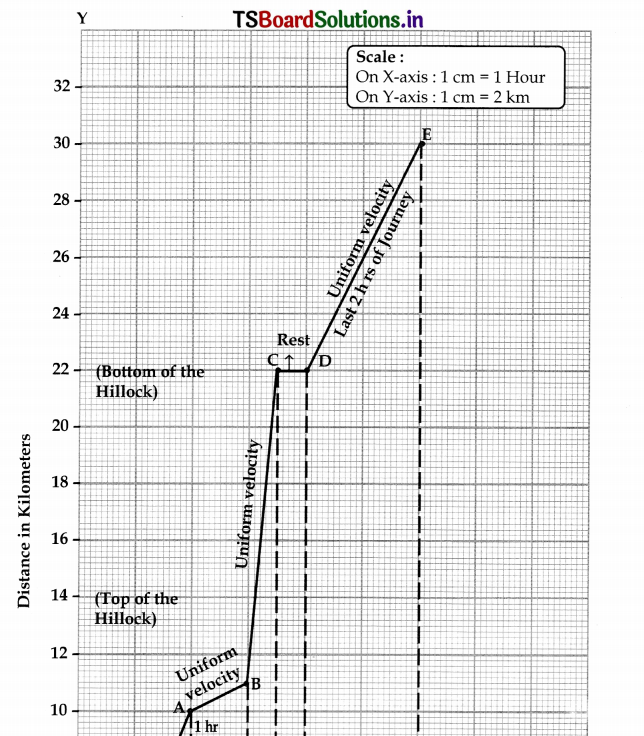
A river is 32 kms away from Nikitha’s house. There is a hillock on the way. Nikitha left for the river one morning on her bicycle. She reached the hillock after 2 hours, pedaling at a speed of 5 kmph. Since she could not cycle up the slope, she continued on foot, walking for an hour at a speed of 3 kmph, and reached the top of the hillock. From there the road was all downhill.
She rode her bicycle at a speed of 18 kmph and reached the bottom of the hillock in half-an-hour. She then rested under a tree for half an hour. Refreshed after a rest, she cycled at a speed of 5 kmph and reached the river in 2 hours. Draw a graph of Nikitha’s journey from her home to the river.
Answer:
Question 2.
Sunitha and her brother Bharat studying in the same school. Sunitha walks to the school while Bharath cycles to the school. So, Sunitha has to leave an hour before Bharath to reach the school on time. Graph 10 shows the graph lines of their journey from their home to the school. Look at the graph and answer the following questions.
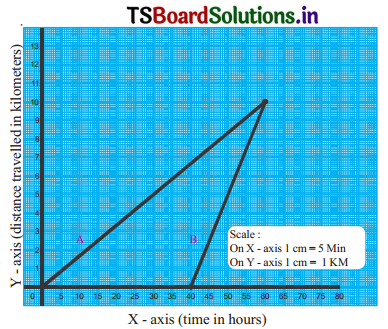
A) Which graph line shows Sunitha’sjoumey’
B) Whose graph line has a greater slope?
C) Whose speed is greater?
D)If Sunitha wants to reach school in 3 hours at what speed should she walk’?
Answer:
A) Graph line ‘A’ shows Sunitha’s Journey.
B) Bharath graph line has greater slope.
C) Bharath’s speed is greater.
D) If Sunitha wants to reach school in 3 hours her speed must be
V = \(\frac{S}{t}\)
Here S = 10 Km
t = 3 hrs
= \(\frac{10}{3} \) kmph
or V = \(\frac{10}{3} \times \frac{5}{18}\) m/sec = \( \frac{50}{54}\) = 0.925 ms-1
Higher-order thinking questions
Question 1.
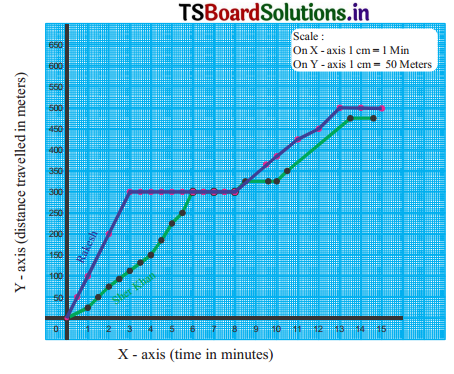
Graph 11 shows the journey of Rakesh and Share Khan. Write a story about their journey on the basis of the graph?
Answer:
Journey of Rakesh:
- In first 3 min of time he travelled a distance of 300 meter. The slope of the graph is large during this period. That means he is moving with large velocity. At the end of 3rd minute his velocity is 100 meter/min.
- From 3rd minute to 8th minute Rakesh has travalled zero distance. That means he is at rest during this time.
- From 8th minute to 11t1, minute once again he is moving with more velocity since the slope of the graph is more. In this 3 minutes he has travelled a distance of 125 meter [425 m – 300 m]. At the end of 11th minute his velocity is 41.6 meter/ minute.
- In the next one minute that is from 11th to 12th minute he has travelled only 25 meters.
- From to 13th minute (In one minute time) he has travelled 50 meters. Then his velocity is 30 meter/minute.
- From 13th to 14t1 minute once again Rakesh came to rest. That means his velocity is zero.
Journey of Sharekhan:
- In the first minute he travelled a distance of 25 meter with a velocity 25 meter/ minute.
- In the second minute he travelled from 25 meter to 75 meter distance that means he travelled 50 meter with 50 meter/minute speed.
- In the next two minutes i.e. from 2nd to 4th minute he travelled up to 150 meter. During this period he travelled a distance of 75 meter with speed 37.5 meter/ minute speed.
- In the next minute that is from 4th to 5th minute he travelled upto 225 meter that means he cover 75 meter [225-150] in one minute with a speed of 75 meter/minute.
- In the next 30 seconds he travelled upto 250 meter that means he travelled 25 meter in half minute is 50 meter/minute speed.
- In the next 30 seconds he travelled upto 300 meter that means he travelled 50 meters in minute. His speed is 100 meter/minute speed.
- In the next 2 minutes Shareklian is at rest. His speed is zero.
- In the next half minute he travelled a distance of 25 meter and from 8.5 minute to 10 minutes he came to rest.
- From 10th minute to 12.5th minute that is 3.5 minute he moved with large speed. He covered from 325 meter to 475 meter. 150 meters in 3.5 minutes with a speed of 42.8 meter/minute.
- From 12.5th minute to 13.5th minute that is for next one minute he is at rest.
Multiple Choiœ Questions
Question 1.
What does the slope on a distance versus time graph represent? [ ]
a) Displacement
b) Speed
c) Wlocity
d) Acceleration
Answer:
b) Speed
Question 2.
Which of the following graph represents constant speed (or) uniform motion [ ]
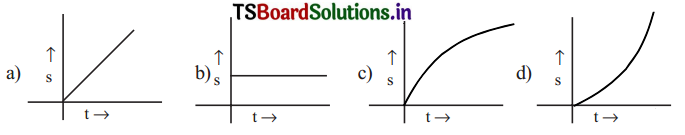
Answer:
img
Question 3.
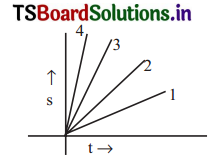
The distance-time graphs of four vehicles 1,2,3 and 4 are given in the adjacent figure. flitch of them has greater speed? [ ]
a) 2
b) 3
c) 1
d) 4
Answer:
d) 4
Question 4.
The given below distance-time graph remnants the motion of a cart. During in which interval the cart is at rest [ ]
a) AB
b) DE
c) BC
d) CD
Answer:
d) CD
Question 5.
According to graph, as time increases, the speed of the object ……………… .[ ]
a) Increases
b) decreases
c) remains same
d) we cannot say
Answer:
c) remains same
TS 8th Class Physics 112th Lesson Graphs of Motion Intext Questions
Question 1.
Can we guess the unit of speed if the distance covered is measured In centimeters and the time in seconds? (T.P-172)
Answer:
cm/sec or cm s-1
Question 2.
What will the unit of speed be it the distance covered is measured in meters and the time In minutes? (T.P-172)
Answer:
meter/minute (or) meter minute-1.
Question 3.
Raja travelled 15 kIlometers In 3 hours. Calculate his average speed and write the correct unit of speed. (T. P-172)
Answer:
Average speed = \(\frac{\text { Total distance }}{\text { Total time }} \)
= \(\frac{15}{3}\) = 5 kmph
or 5 kmph = 5 x \(\frac{5}{18}=\frac{25}{18}\) m/sec
Question 4.
Can you estimate how long Swathi takes to reach her school by looking at the map? (T.P-174)
Answer:
Total distance travelled = 720 m
Total time taken is = 10 minutes
She took lO minutes to travel 720 meters
Question 5.
Can we guess how many turns there are along the road from 5wathis home to her school, or where the road crosses the river, by looking at the graph? (T.P-174)
Answer:
There are two terms. She crossed the river when she is walking from 240m to 360 m.
Question 6.
Did Swathi cover an equal distance in every two-minute interval of her journey? (T.P-174)
Answer:
Yes she covered equal distance of 120 meters in every two minutes.
Question 7.
How would the graph of time and distance look for an object travelling with uniform motion? (T.P-174)
Answer:
It is moving with uniform velocity.
∴ The shape of graph is straight line having positive slope.
Question 8.
What was Swathi’s speed for each two-minute segment of her journey. (T.P474)
Answer:
Swathi’s speed = \(\frac{120}{2}\) = 60 meter/min
or
= \(\frac{60}{60}\) = 1m/sec.
Question 9.
Calculate the average speed of Swathi’s complete journey? (T.P-174)
Answer:
Average speed = \(\quad \frac{\text { Total distance travelled }}{\text { Total time taken to cover the distance }} \)
= \(\frac{720 \mathrm{~m}}{10 \mathrm{~min}}\)
= 72 meter/minute
or
= \(\frac{72}{60}=\frac{7.2}{6}\) = 1.2 m/sec
Question 10.
Is the speed for each two minutes segment the same as her average speed for the entire journey? (T.P-174)
Answer:
No. Her speed in each two minutes = 1 m/sec
Her average speed = 1.2 m/sec
Question 11.
Can you tell who ran faster just by looking at the graph? (T.P-175)
Answer:
Hitesh can travel fast.
Question 12.
How much time did Hitesh take to run from home to school? Calculate his average speed. (T.P-175)
Answer:
Total time = 7 minutes
Average speed = \(\frac{\text { Total distance travelled }}{\text { Total time taken to cover the distance }}=\frac{840}{7}\)
= 120 meter/minutes or \(\frac{120}{60}\) = 2m/sec.
Question 13.
What was the average speed of Anish? (T.P-175)
Answer:
Average speed of Anish
= \(Total distance travelled
$\overline{\text { Total time taken to cover the distance }}$ \) = \(\frac{840}{14} \)
= 60 meter/minute
or
= \(\frac{60}{60}\) = 1 meter/sec or 1 ms-1.
Question 14.
Take another look on graph – 2. Which graph line has the greater slope – Hitesh’s or Anish’s? (T.P-175)
Answer:
Hitesh
Question 15.
Is his speed faster too? (T.P-175)
Answer:
Yes. His speed is faster.
Question 16.
Can you say by looking at the table whether Bhoomika rested somewhere during her journey? (T. P-175)
Answer:
She was at rest from 6-8.8 to 10 and 10 to 20 minutes. So for 6 minutes, she was at rest.
Question 17.
After walking how many minutes did Bhoomika take rest? (T.P-175)
Answer:
After walking Bhoomika took 6 minutes rest.
Question 18.
How would you show the duration of her rest In a graph? (T.P-175)
Answer:
Straight line parallel to X-axis.
Question 19.
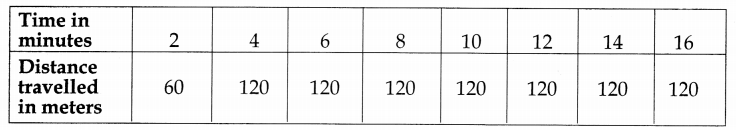
Copy table -4 In your exercise book and fill the blanks. (T.P-176)
Answer:
| TIME Distance (in minutes) | Travelled (In meters) |
| 2 | 60 |
| 4 | 120 |
| 6 | 180 |
| 8 | 180 |
| 10 | 180 |
| 12 | 180 |
| 14 | 240 |
Question 20.
What is the scale for X-axis? (T.P-176)
Answer:
1 cm = 5 minutes
Question 21.
What is the scale of Y-axis? (T.P-176)
Answer:
1 cm = 100 meters.
Question 22.
What was Sana’s average speed for sectIon AB of her journey? (T.P-176)
Answer:
Average speed = \(\frac{\text { Total distance }}{\text { Total time }} \)
∴ Average speed during AB = \(\frac{400}{20}\)
= 20 meter/minute = \(\frac{1}{3}\) ms-1
Question 23.
What was her average speed for section CD of her journey? (T. P-176)
Answer:
Average speed during CD = \(\frac{600-400}{45-35}=\frac{200}{10}\)
= 20 meter/minute = \(\frac{20}{60}=\frac{1}{3}\) ms-1.
Question 24.
Calculate Sana’s average speed for her entire journey. (T.P-176)
Answer:
Average speed for entire journey = \(\frac{\text { Total distance }}{\text { Total time }} \)
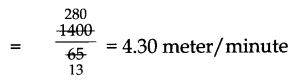
= 0.3589 ms-1
Question 25.
After covering what distance did Sana take rest and for how long did she take rest? (T.P-176)
Answer:
After traveling 400 meters Sana took rest for 15 minutes.
Question 26.
Which section of the graph has a greater slope AB or CD? (T.P-176)
Answer:
It has greater slope between D lo E that is DE.
Question 27.
Is the motion of the train uniform when It leaves the station? (T. P-176)
Answer:
Yes, it is uniform.
Question 28.
What changes took place in the motion of the train when it comes to a halt at a station? (T.P-177)
Answer:
Suddenly it comes to rest.
Question 29.
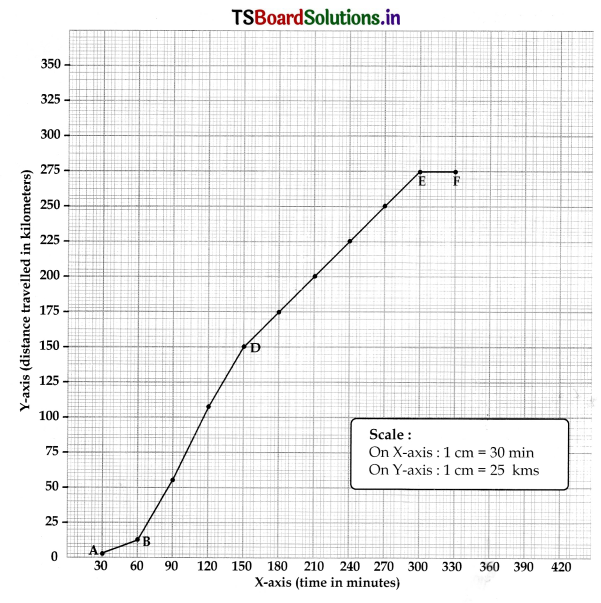
Find the distance covered by the train for every 30-minute interval of time by observing in the graph and note the values In table. (T.P-177)
Answer:
| Time in min. | Distance in km | Difference |
| 0-30 | 2 | 2 |
| 30-60 | 10 | 8 |
| 60-90 | 32.5 | 22.5 |
| 90-120 | 50 | 17.5 |
| 120-150 | 50 | 0 |
| 150480 | 25 | 25 |
| 210-240 | 25 | 0 |
| 240-270 | 25 | 0 |
| 270-300 | 0 | 25 |
| 300-330 | 250 | 250 |
Question 30.
Did the train cover equal distances in equal intervals of time ? (T.P-177)
Answer:
No. Only between BC with some uniform velocity and CD with some other uniform velocity.
Question 31.
Which section of the graph shows the nonuniform motion of the train? (T.P-177)
Answer:
A to E
Question 32.
Which section of the graph shows uniform motion of the train?
Answer:
A to B, B to C, and C to D shows uniform motion but with different uniform speeds.
Question 33.
In which section of the graph was the train at rest?
Answer:
The train is at rest in th section D to E.
Question 34.
Observe at the sections of nonuniform and uniform motion of the train in the graph. What prime difference do you notice between these two sections?
Answer:
A to B uniform with less speed, B to C uniform with highest speed, C to D uniform with speed less than between B to C and more than between A to B.
Question 35.
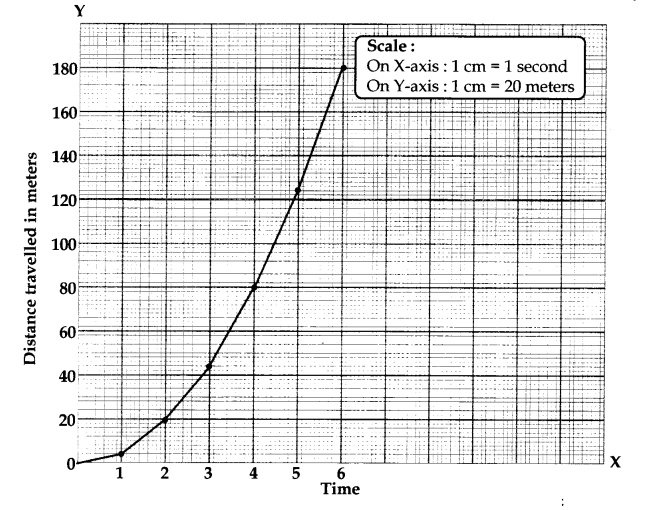
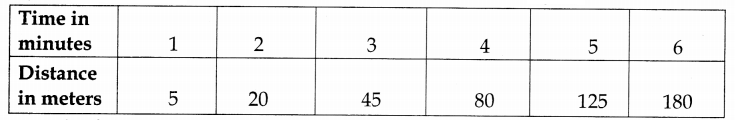
Draw a graph of motion of the turtle’s fail. (T.P-178)
Answer:
Question 36.
What does the graph look like? What Is the shape of the graph? (T.P-178)
Answer:
It is not a straight line but straight line at every section.
Question 37.
Guess type of the basis of this graph can you. Is it the motion of the turtle was uniform or non-uniform? (T.P-178)
Answer:
Non-uniform
Question 38.
How long did the turtle take to fall into the lake from a height of 180 meters?
Answer:
6 secs.
Question 39.
What was the average speed of the turtle during its fall? (T.P-178)
Answer:
130ms
Question 40.
After walking how many kilometers did Aay meet Rajesh? (T.P-180)
Answer:
15km
Question 41.
How many hours did Ajay take to reach the city from his village? (T.P-180)
Answer:
8hrs
Question 42.
What was average speed of Ajay’s for the first five hours? (T.P-180)
Answer:
\(\frac{8+6}{5}=\frac{14}{5}\) =2.8kmph
Question 43.
What is the distance between the village of Ajay and the city? (T.P-180)
Answer:
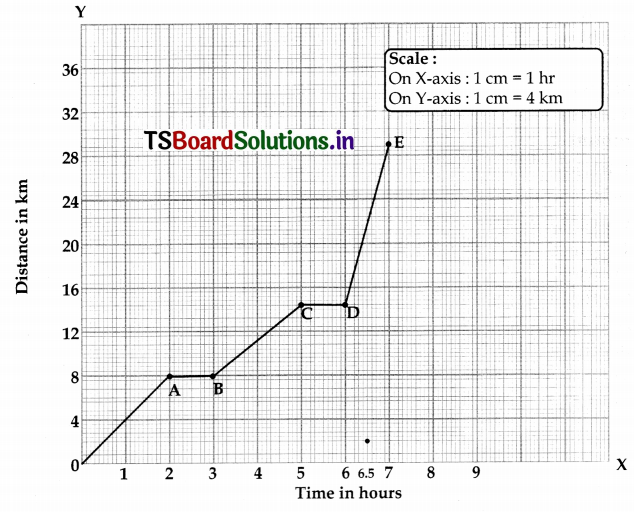
(4 x 2)+(3 x 2)+(10 x 1.5) = 8+6+15 = 29 km
Question 44.
Which section of the graph has the maximum slope? (T.P-180)
Answer:
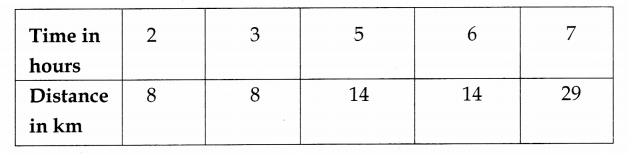
\(\frac{250}{5}\) =50 meter/minute
Question 45.
What was Ralzee’s speed per minute? (T.P-180)
Answer:
10 minutes.
Question 46.
How fares Divya’s home from the school?
Answer:
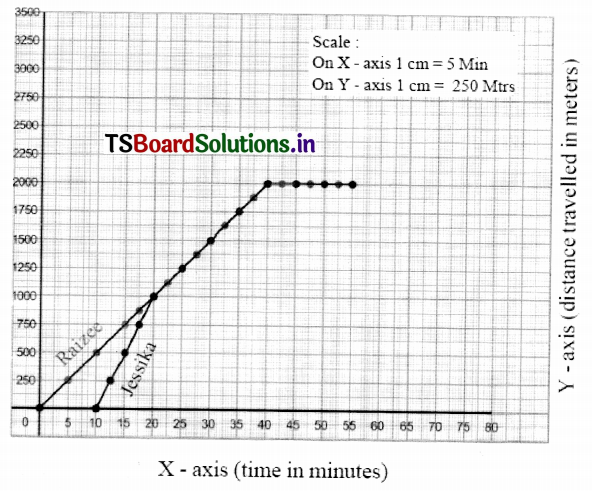
1200m
Question 47.
How much time did Mounika take to reach her home?
Answer:
10 minutes
Question 48.
How much time did Divya take to reach her home?
Answer:
10 minutes
Question 49.
Did Divya stop on the way? For how much time did she stop?
Answer:
No.
Question 50.
Calculate Divya’s average speed during her journey.
Answer:
\(\frac{1200}{12}\) = 100 meter/minute
Question 51.
Did Mounika halt anywhere? How much time did she stop?
Answer:
Yes. Mounika halted for 6 minutes after reaching 600 meters.
Question 52.
Calculate Mounikas’ average speed during her journey.
Answer:
\(\frac{1200}{12}\) = 100 meter/minute
Think & Discuss
Question 1.
Why should we take time on X-axis and distance covered on Y-axis. (T.P-173)
Answer:
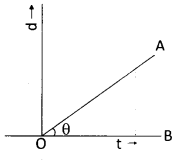
While drawing graphs we must always take scalar on X-axis vectors on Y-axis. Here distance-graphs are plofted taking time on X-axis the reason for this is we can find the speed of the person just by calculating the slope.
Here slope = \(\frac{\mathrm{AB}}{\mathrm{OB}}\)
If you take time on Y-axis cannot find slope directly.
TS 8th Class Physics 12th Lesson Graphs of Motion Activities
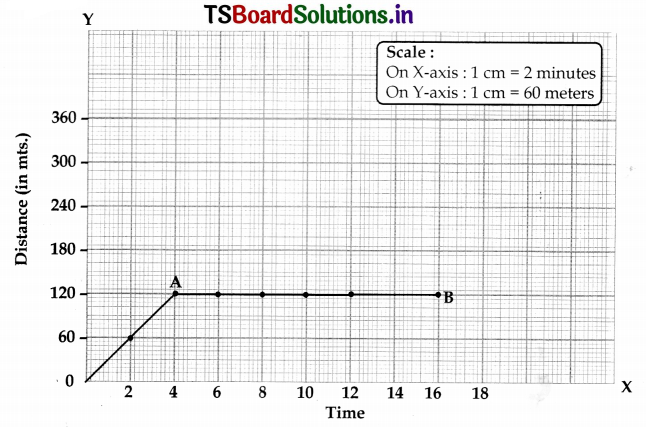
Activity 1 :
1.Details of Swathi journey to school from Home.
Answer:
- A girl Swathi walked from home to school.
- In regular intervals of time 2 minutes she has travelled a distance of 120 meters.
- Totally she has travelled 12 minutes.
- She reached the school after covering 720 meters.
- A graph is drawn taking time on X-axis and distance travelled by the girl on Y-axis.
- From the graph we can findout her speed at any time and the total distance to\ school.
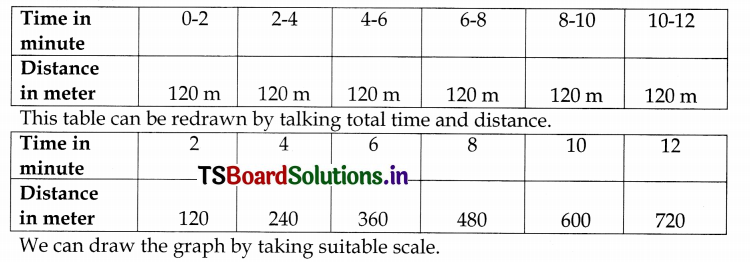
We can draw the graph by taking suitable scale.
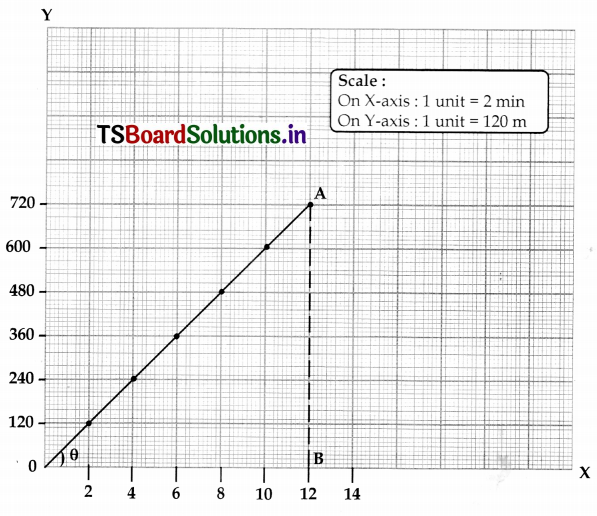
From the graph we can find:
a) Distance travelled in 12 minutes = 720 meters.
b) Speed of Swathi can also be determined by determining the slope.
Speed = \(\frac{\mathrm{AB}}{\mathrm{OB}}=\frac{720}{12}\) = 60 meter/minute
c) Swathi is travelling with uniform speed.
Activity 2:
2. Details of Anish and Hitesh travelling with different uniform speeds:
Answer:
1) Anish and Hitesh raced from their home to school.
2) They travelled with uniform speed. But both of them are travelling with different speeds.
3) Taking time on X-axis and distance travelled by them on Y-axis, a graph is drawn.
4) The shapes of the graphs are straight lines having different slopes.
5) From the graph we can understand that speed is more when slope is more.
6) To draw the graphs the following table are used.
Anish:
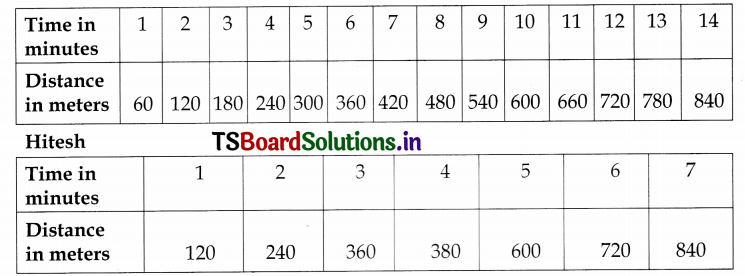
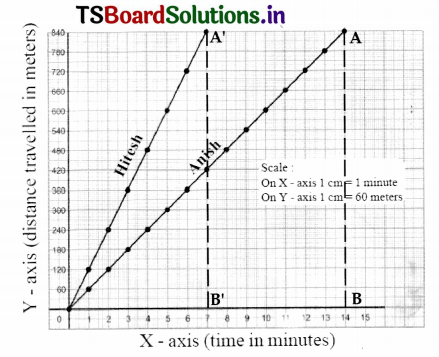
From the graph Details of Anish:
- Distance travelled in 14 minutes = 840 meter.
- His speed is uniform
- The speed is given by slope of the graph Slope = \(\frac{\mathrm{AB}}{\mathrm{OB}} \)
= \(\frac{840}{14} \) =60 meter/minutes
Details of Hitesh:
- Distance travelled in 7 minutes = 840 meter.
- His speed is uniform.
- The speed is given by slope of the gaph.
Slope =\(\frac{\mathrm{A}^{\prime} \mathrm{B}^{\prime}}{\mathrm{OB}^{\prime}}=\frac{840}{7} \) = = 120 meter/minutes
Activity 3:
3. Bhoomika Journey:
1. A distance-time graph is drawn taking time on X-axis and distance travelled onY-axis.
2. With the help of this graph we can find the speed of Bhoomika in different stages.
Result from the graph:
- During the ‘OA’ section of graph Bhoomika travelled 120 meters in 4 minutes with uniform speed.
- Her speed is given by \(\frac{\mathrm{AN}}{\mathrm{ON}}=\frac{120}{4} \) = 30 meters/minute.
- During the AB section of graph Bhoomika is at rest for about 8 minutes.
- After starting at B, he travelled for 4 minutes and reached 240 meter. Her speed is given by \(\frac{\mathrm{CN}}{\mathrm{BN}}=\frac{120}{4}\) = 30 meter/minute
Activity 4:
4. Describe Sanas Journey from the following distance-time graph:
- Here time is taken on X-axis the scale is taken is on X-axis
1 unit = 5 minutes - Distance is taken on Y-axis the scale on Y-axis is 1 unit = 100 meters
- From the AB section we can say that Sana is moving with uniform speed, here speed is determined by the slope of the graph.
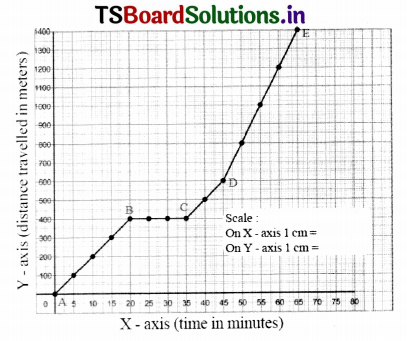
Speed – Slope = \(\frac{400}{20}\) = 20 metrer/ minute
[∴ \(\frac{400-0}{20-0}\)]
4. During BC section of the graph we can conclude Sana is at rest for 15 minutes (i.e. from 20 to 35 mm)
5. During the section of CD graph once again Sana moving with uniform speed Here speed is given =\(\frac{200}{10}\) = 20 meter/minutes
[∴ \(\frac{600-400}{45-35}\)]
6. During the section of DE graph Sana is moving with large uniform speed.
= \(\frac{1400-600}{65-45}=\frac{800}{20}\) = 40 meter/minutes
Activity 5:
5. Distance-time graphs for Non-uniform motion:
1. Abhilash travelled by train from Khammam to Secunderabad.
2. He estimated the distance travelled by the train in each 30 minutes.
3. Taking time on X-axis and distance on Y-axis a graph is drawn taking the following reading.
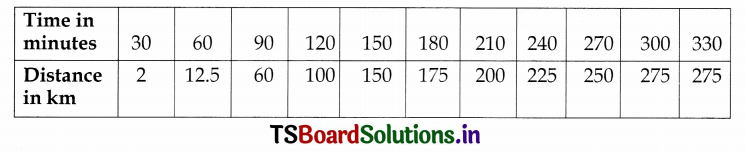
Result:
- During AB section of the graph the tram is travelling with uniform motion with a speed = \(\frac{10 \mathrm{~km}}{60 \mathrm{~min}}=\frac{1}{6} \) km/mm
- During BC section of the graph the train travels with large uniform speed of
= \(\frac{150-10}{120-60}=\frac{140}{60}=\frac{14}{6}\) km/minute - During CD section of the graph the train once again goc slow but with uniform speed =\(\frac{250-150}{240-150}=\frac{100}{90}=\frac{10}{9} \) km/minute
- During DE section of the graph the train is at rest.
Activity 6:
6. Motion of the Turtle falling from the beaks of Swans:
1. Two swans carries their friend turtle by holding the two ends of the stick firmly in their beaks with the turtle gripped on the middle of the stick with its teeth.
2. The swans flew to a height 180 meters and carries the turtle along.

3. On their path turtle was overwhelmed by the beautiful scene below and said ‘WOW,.
4. Naturally it falls down.
5. The times and fall of the turtle through a distance are tabulated.
6. A graph taking time on X-axis and distance on Y-axis a graph is drawn.
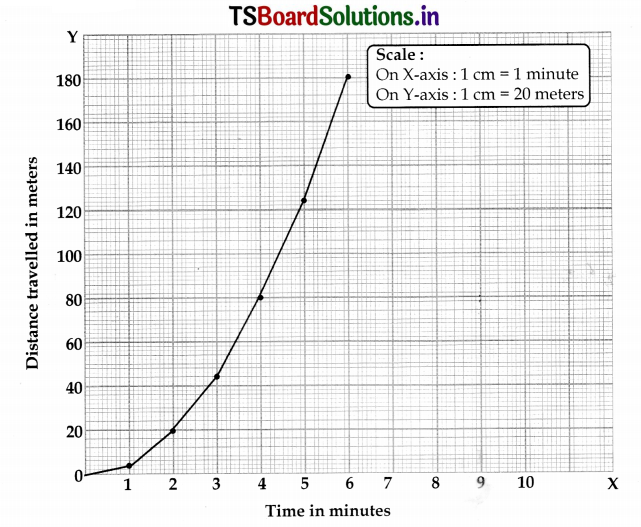
Result of the graph:
1) The slope of the graph is a straight hie in each section.
2) Motion of the turtle is Non-uniform.
3) It takes 6 seconds to fall from a height of 180 m.
Activity 7:
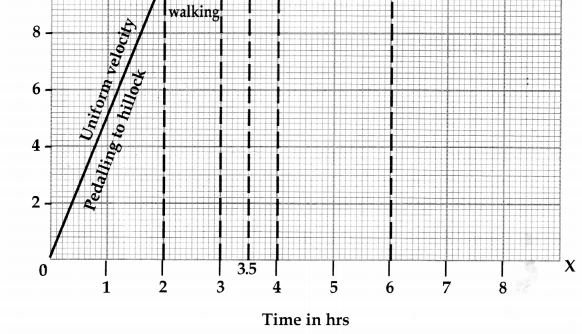
7. Anitha with uniform and Non Uniform motion:
1. From the graph we can understand that Anitha is moving with Nonuniform speed.
2. From AB section of the graph, we can understand that she is pedaling hard. Since in more time she travelled less distance, she is going uphill.
3. From BC section of the graph she is going down the slope. We can understand that she has travelled more distance in less time.
4. During the CD section of the graph we can understand Anitha is at rest.
5. During the DE section of graph once again she is moving with more speed. That means she is going down the slope and pedaling.
Activity 8:
Journey of Ajay and Rajesh:
- In the OA section of the graph Ajay travelled with 4 Kmph speed for 2 hr. So he travelled 8 km.
- In AB section of the graph Ajav took rest for one hour.
- In BC section of the graph Ajay travelled with 3 kmph speed for 2 hrs. So he travelled 6 km. That means he reached 14th kilometer.
- He met his friend Rajesh at this point. They rested for 1.5 hrs. CD section of the graph indicates that.
- In the last section of graph DE Ajay and Rajesh together moved with 10 kmph for about 1.5 hr. That means they travelled 15 km and reached the city which is at 29 km distance from the beginning.
Activity 9 :
9. Journey of Raizee and Jessika
Journey of Raizee:
- From 0 minutes to 40 minutes she travelled with uniform speed.
- In this part, the graph is having positive slope.
- From 4th minute to 55th minute. she was at rest.
Journey of Jessika:
- Jessika started her journey alter 10 minutes.
- From 10 minutes to 20 minutes she ran fast.
- This part of the graph slope is maximum.
- She joined with Raizee at 20th minute after travelling 1000 meters.
- From 20th minute to 40th minute both moved with same velocity.
- From 40th minute to 55th minute both are at rest.
Activity 10:
10. Journey of Mounika and Divya:
Mounika Journey:
- From Zero a the minute to 4th minute she travelled, 80 m with a speed of 200m / min.
- From 4th minute to 10th minute Mounika was at rest.
- From 10th to 12 minute sh travelled from 800 meter to 1200 meter in 2 minutes. with a speed of 200 meters/minute.
Divya Journey:
- Divya travelled from zeroath minute to 12th minute she travelled 1200 meters.
- She travelled with a speed of 100 meters/ minute.
- After 12th both have travelled 1200 meters.
Activity 11:
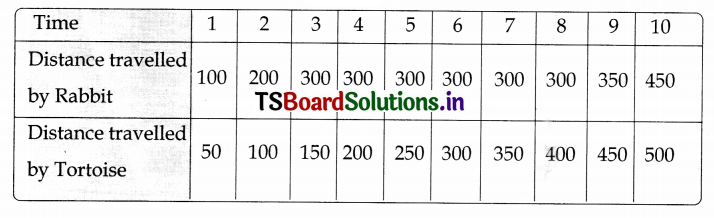
11. Rabbit & Tortoise
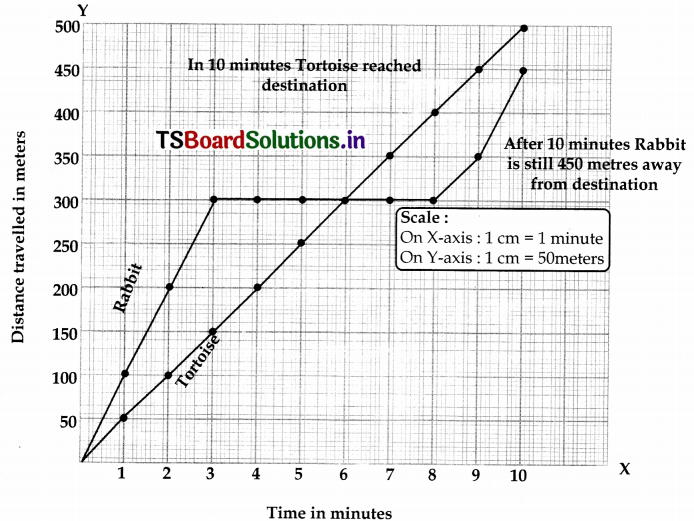
- Tortoise moved with uniform speed.
- In 8 minutes it reached 800 meters.
- It moved with uniform velocity of 100 meter/minutes.
- In case of Rabbit it moves very fast, for first 2 minutes it went tip to 400 meters.
- Its speed is 200 meters per minute.
- It was at rest from 2d minute to 5th minute.
- For about a minute once again it travelled fast.
- After 6 minutes it came to rest once again and lost the race.
We can find distance travelled by Rabbit and Tortoise like this