These AP 10th Class Maths Chapter Wise Important Questions Chapter 14 Statistics will help students prepare well for the exams.
AP State Syllabus 10th Class Maths 14th Lesson Important Questions and Answers Statistics
Question 1.
Write the formula for the median of a grouped data. Explain symbol with their used meaning.
Solution:
Medain (M) = [ l + \(\frac{\frac{\mathrm{n}}{2}-\mathrm{c.f}}{\mathrm{f}}\) ] × h
l = lower limit of the median class,
n = sum of the frequency
c.f = cumulative frequency of the class preceding the median class
f = frequency of the median class
h = length of the class
Question 2.
Find the median of 5, 3, 1, – 4, 6, 7, 0.
Solution:
The given observations are 5, 3, 1,-4, 6,7,0.
Writing the observations in ascending order, we have – 4, 0, 1, 3, 5, 6, 7.
There are 7 observations. Hence the median will be (\(\frac{7+1}{2}\))th observation i.e., 4th observation. The 4th observation is 3.
Hence, the median is 3.
![]()
Question 3.
Find the mode of 5, 6, 9, 6,12, 3, 6, 11, 6, 7.
Solution:
In the given data 5, 6, 9, 6, 12, 3, 6, 11, 6 and 7 the frequency of 6 is maximum.
Hence mode = 6
Question 4.
Find the mean of first ‘n’ natural numbers.
Solution:
Mean = \(\frac{\text { Sum of first ‘n ‘ natural number }}{\mathrm{n}}\)
= \(=\frac{\Sigma n}{n}=\frac{p(n+1)}{2(n)}=\frac{n+1}{2}\)
∴ \(\frac{n+1}{2}\) is the average (mean) of first ‘n’ natural number.
Question 5.
Write the formula for mode of a grouped data. Explain about the symbols with their usual meanings.
(OR)
Write the formula of mode for grouped data and explain each term in it.
Solution:
Mode = [l + \(\frac{\mathrm{f}_{1}-\mathrm{f}_{0}}{2 \mathrm{f}_{1}-\mathrm{f}_{0}-\mathrm{f}_{2}}\)] × h
l = lower boundary of mode class
f1 = frequency of mode class
f0 = frequency of preceding class to , the mode class
f2 = frequency of succeeding class to the mode class
h = size of class
Question 6.
The mean for a grouped data is calculated by \(\overline{\mathbf{x}}\) = a + \(\frac{\Sigma \mathbf{f}_{\mathbf{i}} \mathbf{d}_{\mathbf{i}}}{\Sigma \mathbf{f}_{\mathbf{i}}}\)
What do the terms ‘f.’ and’d.’ represent in the above formula
Solution:
fi = frequency of the ith observation
di = deviation of the ith observation
Question 7.
Find the mean of 5,6, 9,10,6, 12,3,6,11,10.
Solution:
Mean = \(\frac{\text { Sum of scores }}{\text { No.of scores }}\)
= \(\frac{5+6+9+10+6+12+3+6+11+10}{10}\)
= \(\frac{78}{10}\)
= 7.8.
Question 8.
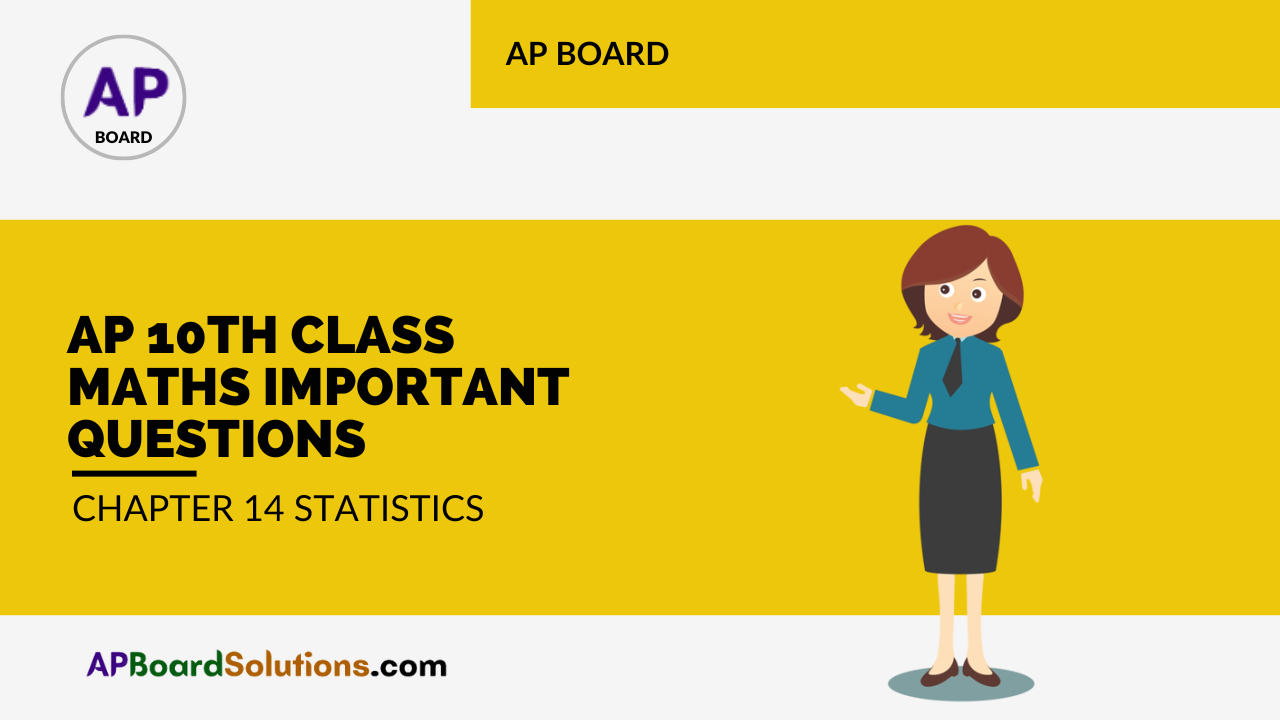
Wite less than cumulative frequency and greater than cumulative frequency table for the following data.
Solution:
Less than Cumulative Frequency table
| Upper boundary of the class | Less than cumulative frequency |
| 10 | 4 |
| 15 | 49 |
| 20 | 69 |
| 25 | 82 |
| 30 | 91 |
Greater than Cumulative Frequency table
| Lower boundary of the class | Greater than cumulative frequency |
| 5 | 91 |
| 10 | 87 |
| 15 | 42 |
| 20 | 22 |
| 25 | 9 |
Question 9.
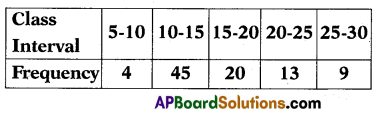
The marks obtained by 20 students of class X of a certain school are given below. Find the mean marks obtained by the students.
Solution:
| Marks (x1) | No. of students (f1) | f1x1 |
| 5 | 1 | 5 |
| 10 | 4 | 40 |
| 15 | 5 | 75 |
| 20 | 2 | 40 |
| 35 | 4 | 140 |
| 40 | 3 | 120 |
| 50 | 1 | 50 |
Σf<sub>i</sub> = 20 Σf<sub>i</sub>x<sub>i</sub> = 470
Mean = a + \(\frac{\Sigma \mathrm{f}_{\mathrm{i}} \mathrm{x}_{\mathrm{i}}}{\Sigma \mathrm{f}_{\mathrm{i}}}=\frac{470}{20}\) = 23.5
![]()
Question 10.
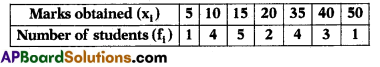
Write mid-values of the following frequency distribution.
Solution:
| C.I | Frequency | Mid -Values |
| 8-11 | 4 | 9.5 |
| 12-15 | 4 | 13.5 |
| 16-19 | 5 | 17.5 |
| 20-23 | 13 | 21.5 |
| 24-27 | 20 | 25.5 |
| 28-31 | 14 | 29.5 |
| 32-35 | 8 | 33.5 |
Question 11.
Prepare a frequency distribution table to the following data with class intervals.
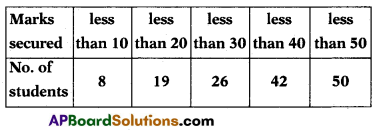
Solution:
| Class Interval | Frequency |
| <10 | 8 |
| 10 – 20 | 11 |
| 20 – 30 | 7 |
| 30 – 40 | 16 |
| 40 – 50 | 8 |
Question 12.
Find the Median of the following data.
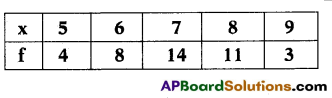
Soltion:
| (x) | f | c.f |
| 5 | 4 | 4 |
| 6 | 8 | 12 |
| 7 | 14 | 26 |
| 8 | 11 | 37 |
| 9 | 3 | 40 |
n = 40
Median = \(\frac{\mathrm{n}+1}{2}=\frac{40+1}{2}=\frac{41}{2}\)
= 20.5th term = 7.
Question 13.
Find the mean of the following data.
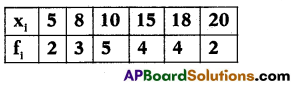
Solution:
| xi | fi | fixi |
| 5 | 2 | 10 |
| 8 | 3 | 24 |
| 10 | 5 | 50 |
| 15 | 4 | 60 |
| 18 | 4 | 72 |
| 20 | 2 | 40 |
Σfixi = 256;Σfi = 20
Mean = \(\frac{\Sigma \mathrm{f}_{\mathrm{i}} \mathrm{x}_{\mathrm{i}}}{\Sigma \mathrm{f}_{\mathrm{i}}}\) = \(\frac{256}{20}\) = 12.8
Question 14.
Find the mode of the following data:
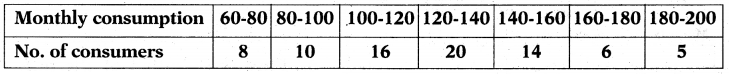
Solution:
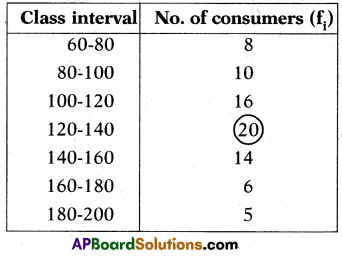
Since the maximum number of consumers (is 20) have got monthly consumption in the interval 120-140, the model class is 120 -140.
The lower boundary (l) of the modal class = 120.
The class size (h) = 20
The frequency of modal class (f1) = 20
The frequency of the class preceding the modal class (f0) = 16.
The frequency of the class succeeding the modal class (f2) = 14.
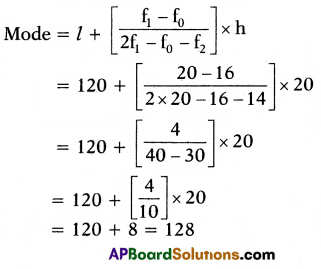
Now, using the formula:
Question 15.
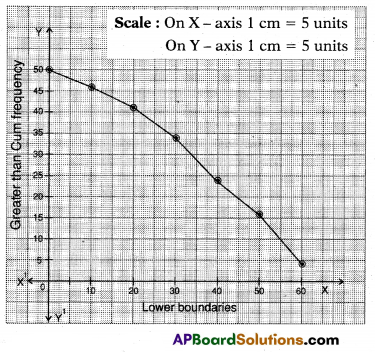
Draw “greater than Ogive curve” for the following data.
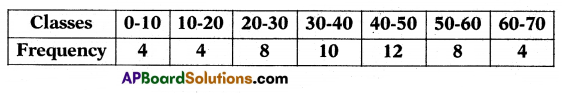
Solution:
| Lower boundary | Frequnecy | Greater than Cummulative Frequency |
| 0 | 4 | 50 |
| 10 | 4 | 46 |
| 20 | 8 | 42 |
| 30 | 10 | 34 |
| 40 | 12 | 24 |
| 50 | 8 | 12 |
| 60 | 4 | 4 |
A graph is plot lower boundaries on X – axis, and GT.C.E on Y – axis
Question 16.
Find the mode of the following data.
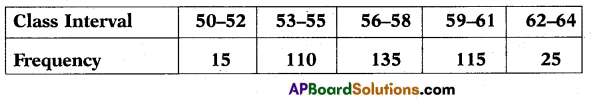
Solution:
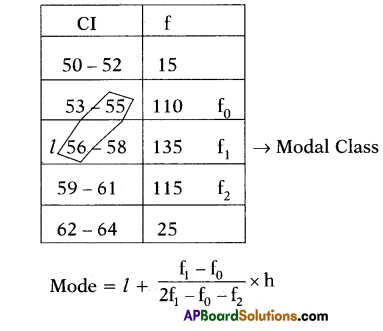
Here l = 55.5, f0
= 110,f1 = 135,
f2 115,h = 3
Mode = 55.5 + 2\(\frac{135-110}{2(135)-110-115}\) × 3
= 55.5 + \(\frac{25}{270-225}\) × 3
= 55.5 + \(\frac{25}{45}\) × 3
= 55.5 + \(\frac{5}{3}\)
= 55.50 + 1.67
= 57.17
![]()
Question 17.
Find the median of the following data.
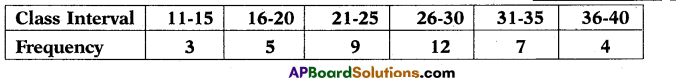
Solution:
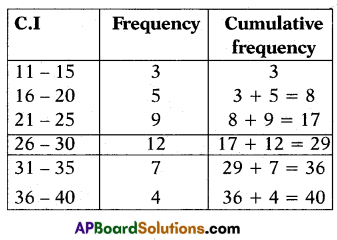
n = 40
\(\frac{\mathrm{n}}{2}=\frac{40}{2}\) = 20
Median class = 26 – 30
Median = M = l + (\(\frac{\frac{\mathrm{n}}{2}-\mathrm{cf}}{\mathrm{f}}\)) × h
l = 25.5; cf = 17; n = 40; f = 12; h = 5
∴ M = 25.5 + (\(\frac{20-17}{12}\)) × 5
= 25.5 + \(\frac{3}{12}\) × 5 = 25.5 + \(\frac{5}{4}\)
= 25.5 + 1.25
=26.75
∴ Required Median = 26.75
Question 18.
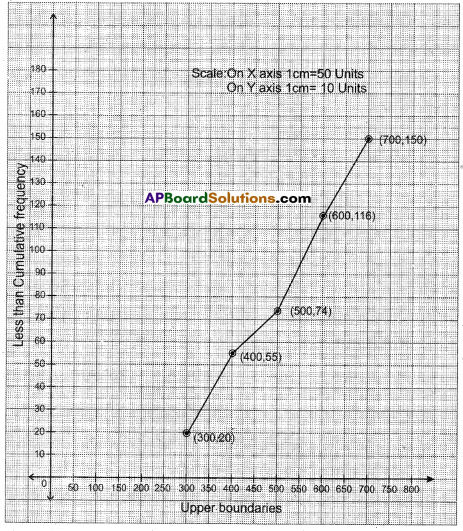
Convert the distribution given below to a less than type cumulative frequency distribution and draw it’s Ogive.
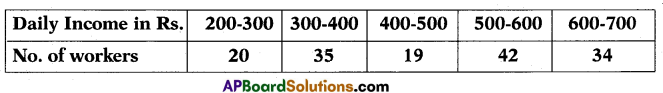
Solution:
| Upper boundary | Less than cumulative frequency | points |
| 300 | 20 | (300 , 20) |
| 400 | 55 | (400 , 55) |
| 500 | 74 | (500 , 74) |
| 600 | 116 | (600 , 16) |
| 700 | 150 | (700 , 150) |
Question 19.
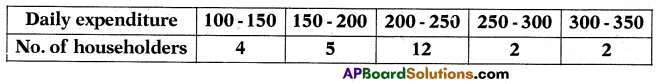
The following table shows the daily expenditure on grocery of 25 households in a locality. Find the ‘Mode’ value of daily expenditure on grocery.
Solution:
Daily expenditure data of 25householders
| Daily Expenditure | No. of householders |
| Cl | fr |
| 100 – 150 | 4 |
| 150 – 200 | 5 |
| 200 – 250 | 12 |
| 250 – 300 | 2 |
| 300 – 350 | 2 |
The class having maximum frequency
(12)is (200 – 250)
Then formula for mode
l + (\(\frac{f_{1}-f_{0}}{2 f_{1}-f_{0}-f_{2}}\)) × h
Where
‘l’ is lower boundary of modal class = 200
‘f1’ is frequency of modal class = 12
‘f0‘ is frequency of class preceeding the modal class = 5
‘f2‘ is frequency of class succeeding the modal class = 2
‘h’ is height of class = 50
Now substituting the above values in the formula, we get
Mode = 200 + (\(\frac{12-5}{24-5-2}\)) × 50 = 200 + \(\frac{7 \times 50}{17}\) = 200 + \(\frac{350}{17}\) = 200 + 20.58
∴ Mode = 220.58.
Question 20.
The following data indicates marks of 53 students in a test.
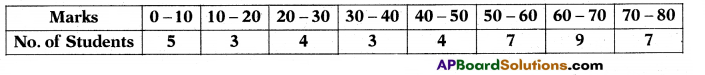
Draw a “Less than Ogive curve” for the data.
Solution:
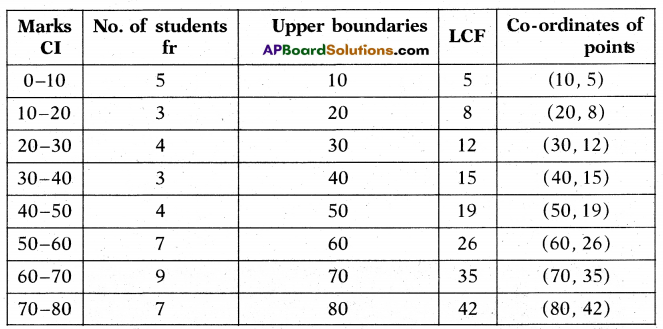
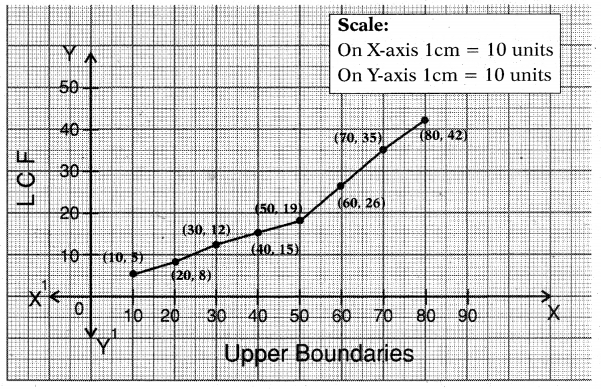
Considering upper boundaries on X-axis and LCF on Y-axis. We plot the points and by connecting on free hand we get less than type ogive as shown below graph.
Question 21.
The following table gives daily wages of workers in a certain commercial organization. The mean of this frequency distribution is ₹ 220, then find the missing frequency ‘f’ of this distribution.

Solution:
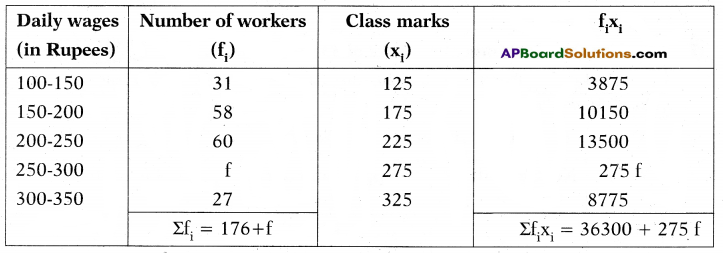
xi = 220 (given)
\(\overline{\mathrm{x}}=\frac{\Sigma \mathrm{f}_{\mathrm{i}} \mathrm{x}_{\mathrm{i}}}{\Sigma \mathrm{f}_{\mathrm{i}}}\)
⇒ 220 = \(\frac{36300+275 \mathrm{f}}{176+\mathrm{f}}\)
⇒ 220(176 + f) = 36300 + 275f
⇒ 38720 + 220 f = 36300 + 275 f
⇒ 220 f- 275 f = 36300 – 38720
⇒ -55 f = -2420
⇒ f = \(\frac{2420}{55}\) = 44
Question 22.
Temperature recorded in the first week of May 2016 are 36°, 32°, 34°, 30°, 42°, 40° and 38°. Then find the average temperature.
Solution:
The recorded temperatures are = 36°, 32°, 34°, 30°, 42°, 40° and 38°.
Sum of Scores
∴ Average = \(\frac{\text { Sum of Scores }}{\text { Number of Scores }}\) = \(\frac{36+32+34+30+42+40+38}{7}\) = \(\frac{252}{7}\) = 36°c
![]()
Question 23.
In 2016 IPL season T-20 matches VIRAT KOHLI scored 975 runs in 15 matches. So find his average.
Solution:
Number of matches played in 2016 season =15, Total runs scored = 975
∴ His average = \(\frac{975}{15}\) = 65
Question 24.
22 students started for a tour with Rs. 3300/-. Two of them dropped with their share Rs. 500/- from the tour. And the remaining completed their tour. So what amount is to be paid in addition by the remaining ?
Solution:
The total number started = 22 members
Number of dropped = 2
Number completed the tour = 20
The amount withdrawn by 2 members = 500
So these five hundred rupees is to be beared by 20 members.
Additional share to each = \(\frac{500}{20}\) = Rs. 25/-
Question 25.
Find the mean of the following.
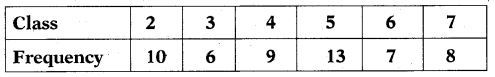
Solution:
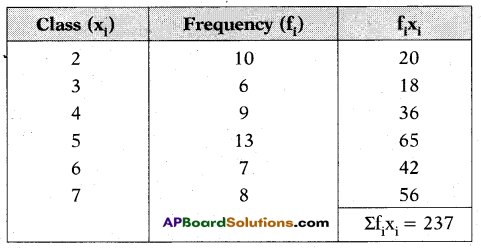
Σf = 10 + 6 + 9 + 13 + 7 + 8 = 53
∴ Mean = \(\frac{\Sigma \mathrm{f}_{\mathrm{i}} \mathrm{x}_{\mathrm{i}}}{\Sigma \mathrm{f}_{\mathrm{i}}}\) = \(\frac{237}{53}\) = 4.47
Question 26.
Which central tendency is more useful to express the ability of a cricketer and why?
Solution:
The best central tendency to express the ability of a cricketer is “ARITHMETIC MEAN” because
Mean is influenced by all measurements.
Maximum/minimum measurements influence on mean is also very high.
The number of matches he played also influence this mean.
So the most effective tendency is ARITHMETIC MEAN.
Question 27.
Where do we use MEAN in day to day life?
Solution:
1. To fix the target pass percentage in a school/ District by the officers.
2. By the knowledge of average rainfall, the officers will prepare some action plan to improve crops, prevent floods, reduce life risk in storms like Hud-Hud.
3. To estimate and fix the cost of a cricketer in the IPL auction basing on his previous average performances. ,
4. To prepare people – cultivators by estimating on basis of previous rainfall, crop output etc.
5. To estimate the progress of a student in various subjects at different levels of examinations.
Thus the Arithmetic mean plays an important role in day to day life of every individual.