Students must practice these AP Inter 2nd Year Economics Important Questions 10th Lesson Economic Statistics to boost their exam preparation.
AP Inter 2nd Year Economics Important Questions 10th Lesson Economic Statistics
Long Answer Questions
Question 1.
What are the uses of dispersion?
Answer:
1) Calculation of Range for ungrouped data:
Example: Find range 20, 25, 29, 30, 35, 39, 41, 48, 51, 60 and 70
Solution: Range = L – S
L = 70 and S = 20
Range =70 – 20 = 50
2) Calculation of Range for a frequency distribution:
Example: For the following distribution of marks scored by a class of 40 students, calculate the range.
| Class intervals (I) | No. of Students (f) |
| 0-10 | 5 |
| 10-20 | 8 |
| 20-40 | 16 |
| 40 – 60 | 7 |
| 60-90 | 4 |
| 40 |
Range is just the difference between the upper limit of the highest class and the lower limit of the lowest class. So the Range is 90 – 0 = 90.
Uses:
i) Range is useful in studying the variations in the prices of stocks and shares and other commodities that are sensitive to price changes from one period to another.
ii) The meteorological department does make use of range in determining, say, the difference between the minimum temperature and the maximum temperature.
iii) The range is a most commonly used measure of dispersion in everyday life. Questions of the form “What is the minimum and maximum temperature on a particular day ?” “What is the difference between wages earned by workers of a particular factory?” “How much one spends on petrol in his car/scooter in a month?” – are all usually answered in the form of range. Answers to questions such as these are usually given in the form of ‘Between such and such’.
![]()
Question 2.
What is meant by dispersion ? Explain the various measures of dispersion.
Answer:
Definitions of Dispersion:
- According to A.L. Bowley, “Dispersion is the measure’of the variation of the items”.
- According to Brooks and Dick, “Dispersion or Spread is the degree of the scatter or variation of the variable about a central value”.
Measures of Dispersion:
The various measures of central value give us one single figure that represents the entire data. But the average alone cannot adequately describe a set of observations, unless all the observations are the same. It is necessary to describe the dispersion of the observations. In two or more distributions the central value may be the same but still there can be wide disparities in the formation of distribution. Measures of dispersion help us in studying this important characteristic of a distribution.
Question 3.
Calculate the quartile deviation for a frequency distribution.

Answer:
First calculate cumulative frequencies as follows:
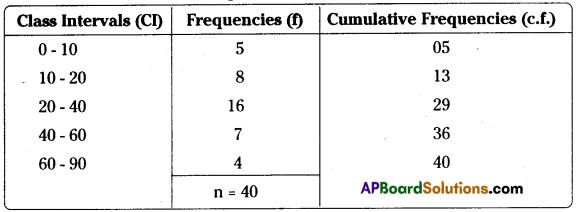
Q1 is the size of n/4th value in a continuous series. Thus it is the size of the 10th value.
The class containing the 10th value is 10 – 20. Hence Q1 lies in class 10 – 20. Now, to calculate the exact value of Q1, the following formula is used:

Where L = 10 (lower limit of the relevant Quartile class)
c.f. = 5 (value of c.f. for the class preceding the Quartile class)
i = 10 (frequency of the Quartile class) ‘
Thus, 
Similarly, Q3 is the size of 3n/4th value, i.e., 30th value, which lies in class 40 – 60. Now using the formula for Q3, its value can be calculated as follows:

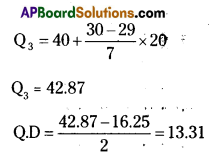
In individual and discrete series is the size of (n+1)/4 the value, but in continuous distribution, it is size of n/4th value. Similarly, for Q3 and median also.
Question 4.
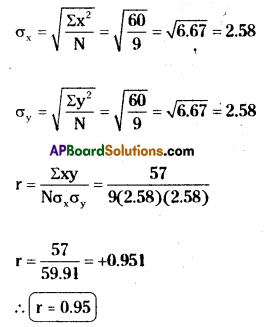
Calculate the Karl Pearson’s coefficient of correlation.

Answer:
Calculation of coefficient of correlation:
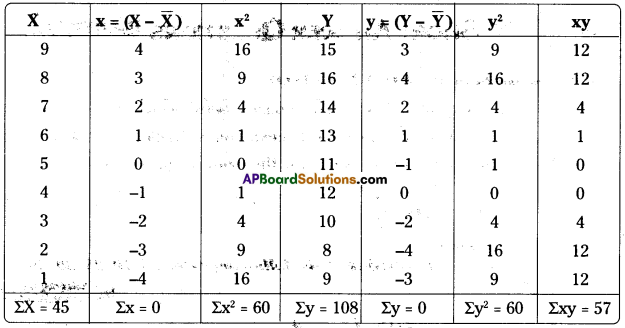
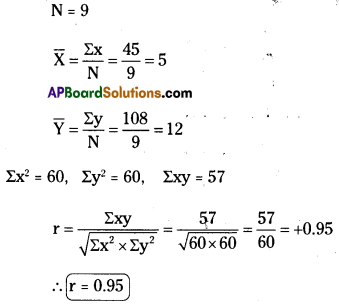
Alternative method:
![]()
Short Answer Questions
Question 1.
Define relation between M.D., S.D. anti Q.D.
Answer:
In a Normal Distribution there is a fixed relationship between the three most commonly used measures of dispersion. The quartite deviation is smallest, the mean deviation next and the standard deviation is largest in the following proportions:

Question 2.
Calculate the standard deviation of the following values 5, 10, 25, 30, 50. [March 2017]
Answer:
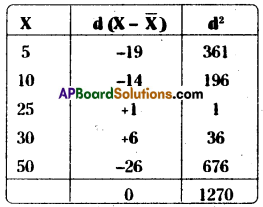
Following formula is used

Question 3.
Define Lorenz Curve ? When is it used ?
Answer:
The measures of dispersion discussed so as to give a numerical value of dispersion. A graphical measure called Lorenz Curve is available for estimating dispersion. You may have heard of statements like top 10% of the people of a country earn 50%. of the national income while top 20% account for 80%. An idea about income disparities is given by such figures. Lorenz Curve uses the information expressed in a cumulative manner to indicate the degree of variability. It is specially used in comparing the variability of two or more distributions.
Question 4.
What is correlation ? State its importance. [Mar ’19 (AP); May ’18, ’17; Mar. ’18]
Answer:
According to A.M. Tuttle, “Correlation is an analysis of the covariation between two or more variables”.
According to Simpson and Kabka, ‘Correlation analysis is an analysis that deals with the association between two or more variables”.
Importance:
- Correlation is a statistical device which helps us in analyzing the covariation of two or more variables.
- It is through correlation that we can predict about the future.
- If the value of a variable is given, we can know the value of another variable.
- Correlation contributes to economic behaviour.
- The technique of correlation coefficient helps to make estimates like sales, price or costs.
Question 5.
How many types of index numbers are there ?
Answer:
The index numbers are, nowadays, used in almost every sphere. However, some of the popular index numbers used in the field of economics and business are classified as under.
- Price Index Number
a) Wholesale Price Index Number
b) Retail Price Index Number - Quantity Index Number
- Cost Living Index Number
- Special Purpose Index Number
![]()
Very Short Answer Questions
Question 1.
Range [Mar ’19 (AP); Mar ’18, ’17; May ’18 ’17]
Answer:
Range is the simplest method of studying dispersion. It is defined as the difference between the value of the smallest item and the value of the largest item included in the distribution.
Range = L – S
Where L = Largest item, and
S = Smallest item
Question 2.
Mean Deviaiton [May 2017]
Answer:
M.D. represents Mean Deviation and is calculated by the formula given below

f = frequency of corresponding interval
N = Total no. of frequencies (∑f)
ΙDΙ = (x-A) is the modules value or absolute value.
Question 3.
Correlation [March 2017]
Answer:
According to A.M. Tuttle, “Correlation is an analysis of the covariation between two or more variables”.
According to Simpson and Kabka, “Correlation analysis is an analysis that deals with the association between two or more variables”.
Question 4.
Rank Correlation
Answer:
Spearman’s Rank Correlation: In Spearman’s Coefficient of Correlation, we take the difference in ranks, scoring them and finding out the aggregate of the squared differences.

Where R = Rank
D = Difference of rank between paired items in two series
N = Number of pairs
Question 5.
Index number [Mar. 19 (AP); May, Mar. 18]
Answer:
According to Croxton and Carden, “Index numbers are devices for measuring different in the magnitude of groups of related variabilities”.
Question 6.
Laspeyre s Price Index formula
Answer:

Question 7.
Paasche’s Price Index Formula
Answer:

![]()
Question 8.
Fisher’s Price Index Formula
Answer:
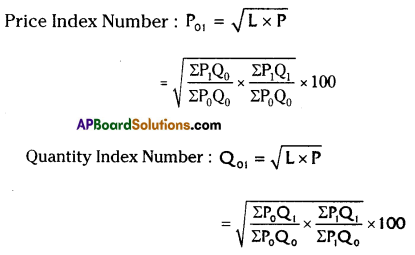
L = Laspeyre’s Index
P = Paasche’s Index