Telangana SCERT 10th Class Social Study Material Pdf Telangana 6th Lesson The Population Textbook Questions and Answers.
TS 10th Class Social 6th Lesson Questions and Answers – The Population
Question 1.
Based on the following table, answer the questions below. World historical and predicted populations (in millions)
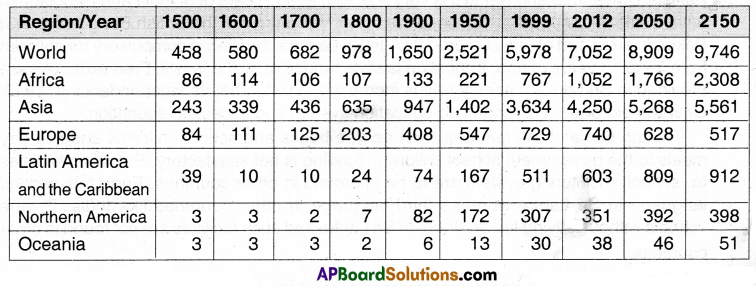
(a) Identify the number of centuries It took for the world population to double for the
first time.
Answer:
300 years.
(b) In earlier classes, you had studied about colonization. Look at the table and identity the continents In which the population decreased by 1800.
Answer:
Oceania.
(c) Which continent has been most populous for most period of Urne?
Answer:
Asia.
(d) Is there any continent that is projected to show a significant decrease in population in future?
Answer:
Europe.
Question 2.
List out the impacts on society if the sex ratio is too low or too high.
Answer:
- The unbalanced sex ratios should be reflected in various social settings. including the modern college campus.
- This ratio impacts the distribution of wealth, alters who sits in board rooms and at the executive levels of corporations, and what governments do over time.
- A high sex ratio can have many implications, including on crime.
- When there is a shortage of women in the marriage market the women can “marry up, inevitably leaving the least desirable men with marriage prospectus.
- Gender imbalance will lead to a reduction in birth rate.
Question 3.
Compare Indian mean years of schooling with other countries: (Text Page No:24. Table 5) Sri Lanka, Nepal, Bangladesh, Myanmar, Pakistan What similarities and differences do you note?
Table: Some data regarding India and its neighbors for 2018
| Country | Jean years |
| Sri Lanka | 11 |
| India | 6 |
| Pakistan | 5 |
| Myanmar | 5 |
| Bangladesh | 6 |
| Nepal | 5 |
Answer:
According to the table given, Sri Lanka is leading in Mean Years of Schooling. In Pakistan. Myanmar and Nepal it is very less with Mean Years of 5. India and Bangladesh have a little better position. All these are colonial countries of the British. Bangladesh arid Pakistan are a part of India before 1947.
In Sri Lanka, schooling is compulsory for children from 5+ to 13 years of age. Education is state-funded at all the levels. Free textbooks are provided in Sri Lanka. Literacy rate is increased to 97% after its independence in 1948.
The government gives high priority to education system and access to education. Though some of the features such as free books and school uniforms and mid-day meals to the government school children, funding is not satisfactory. Providing facilities to school, monitoring system are to be improved in other countries.
English is second language in Sri Lanka whereas third language in other countries like India, Private schools without levying fee are there in Sri Lanka and such facilities are not found in other countries.
![]()
Question 4.
Which areas 0f Telangana have high density of population and what may be some
of the reasons behind it?
Answer:
High density of population in Telangana is observed into both Hyderabad and Ranga Reddy districts, The reasons are
- These two districts are fast-developing areas.
- Many industries are established here.
- Various employment sources and opportunities for livelihood are there.
- Transportation. communication, educational opportunities, medical and health services are improved.
- Maximum construction work is going on.
- Many people from surrounding districts along with distant places migrate to these areas to settle here.
Question 5.
Distinguish between population growth and population change.
Answer:
Population growth: The population growth is the change in a population over time, and can be qualified as the change in the number of individuals of any species in a population using ‘Per Unit Five” for measurement,
Population change: The population change refers to change in the number of people during the specific time.
It Is also defined generally as follows:
Population change is the difference in the size of a population between the end and the beginning of a given time period (usually one year).
Question 6.
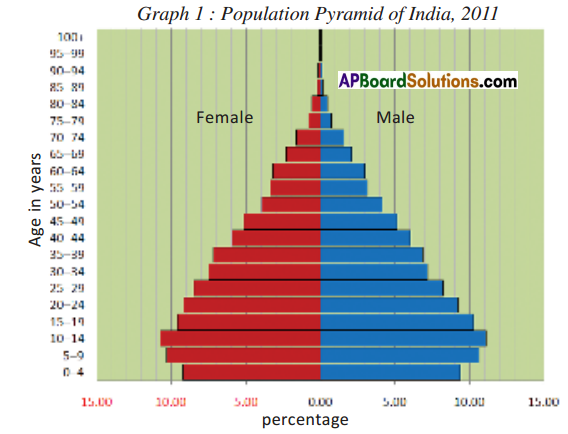
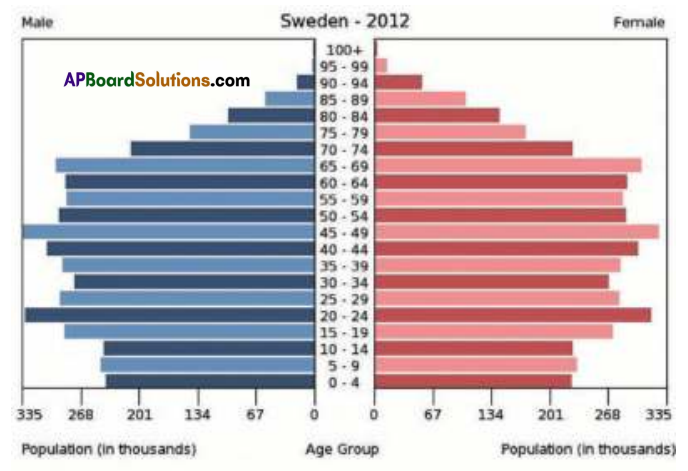
Compare the population pyramid of India with data of three other countries given here.
(a) Which country’s population Is likely to grow?
(b) Which country’s population is likely to reduce?
(c) Compare the gender balance: What can you tall about each country’s family and welfare policies?
Answer:
(a) India’s population is likely to grow.
(b) Sweden’s population is likely to reduce.
(c) Between the given countries, Sweden has sex ratio of 1020 females for – 1000 males,
but India has negative sex ratio – 940 females per 1000 males. As for fancy and welfare policies. Sweden has given importance female population.
Question 7.
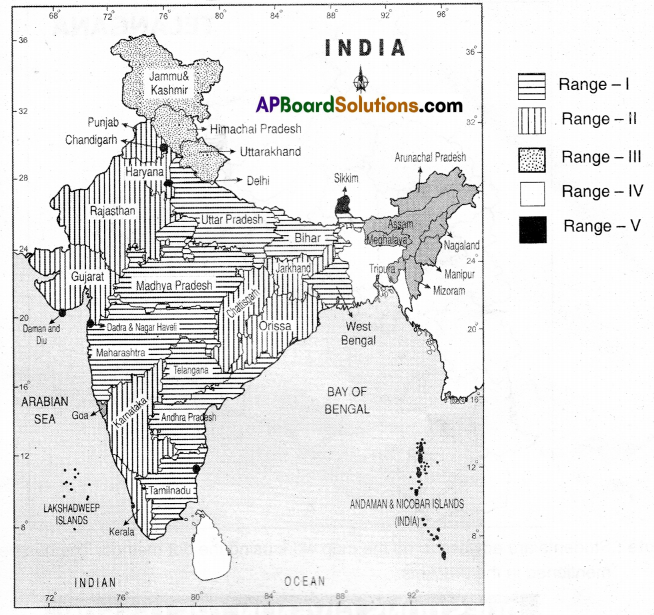
Map work:
a. On a blank map of India showing state boundaries, plot the state-wise population density based on the 2011 census by taking five ranges.
Answer:
Range-I:
1) litter Pradesh – 199,561.477(16.49%)
2) Maharashtra – 112.372.972 (9,28%)
3) BIliar – 103,804,637(8.58%)
4) West Bengal -91.374,736(7.55%)
5) Telangana- 35286.757(2,91%)
6) Andhra Pradesh – 49.388,776(4.07%)
7) Madhya Pradesii -72,597,565 (6.00%)
8) Tami Nadu – 72,138,958(5.96%)
Range – II;
9) Raas1han – 88,621.012(5.67%)
10) Karriataka -61,130,704 (5.05%)
11) Gu(arat – 60,383,628(5.00%)
12) Odisha – 41.947,358(3.47%)
13) Kerala – 33.387.877(2.78%)
14) Jharktiand – 32,966.238 (2J2%)
15)Assom – 31,169,272 (2.56%)
16) Punjab-27.704,236(2.30%)
17) Chattisgarh – 25,540.196(2.11%)
18) Haryana -25,353,081 (2.09%)
Range – III:
19) Jammu and Kashmir- 12.548,926 (1.04%)
20) Uttarakhand – 10,116.752(0.84%)
21) Hirnachal Pradesh – 6,856,509 (0.57%)
Range-IV:
22) Tnpura – 3.671.032(0.30%)
23) Meghalaya – 2,964.007 (0.24%)
24) Mampur – 2,721.756(0.22%)
25) Nagaland -1,980,602(0.16%)
26) Goa – 1.457.723(0.12%)
27) Arunadial Pradesh -1.382,611(0.11%)
28) Mizoram -1,091.014(0.09%)
Range – V:
29) Sikkim – 607.688(0.05%)
30) Deltn -16,753,235 (1.38%) [NCT]
31) Puducherry – 1.244,464(0.10%) [UTI]
32) Chandigarh -1.054,686(0.09%) [UTI]
33) Andaman and Nicobar Islands – 379,944 (0.03%) [UTI]
34) Oawa ar Nar Haveli -342,853(0.00%) [UTI]
35) Daman and Diu – 242.911 (0.02%) (UTI]
36) Lakshadweep- 64.429 (0.01%) [UTI]
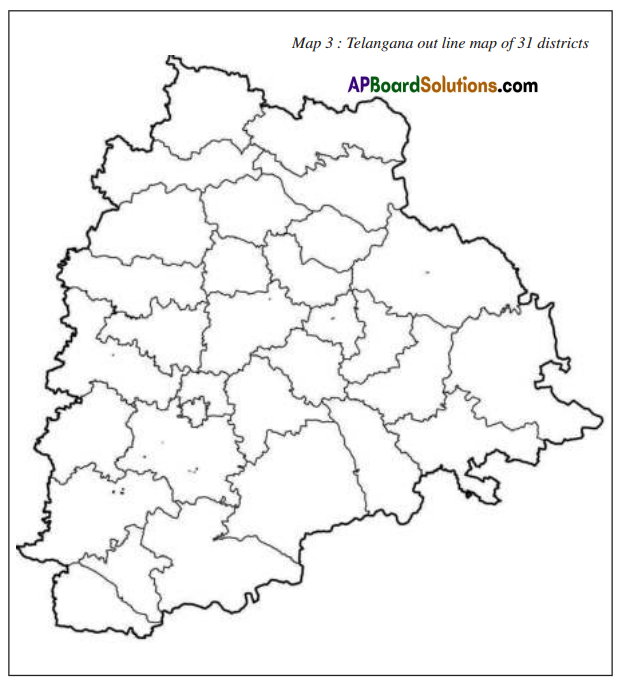
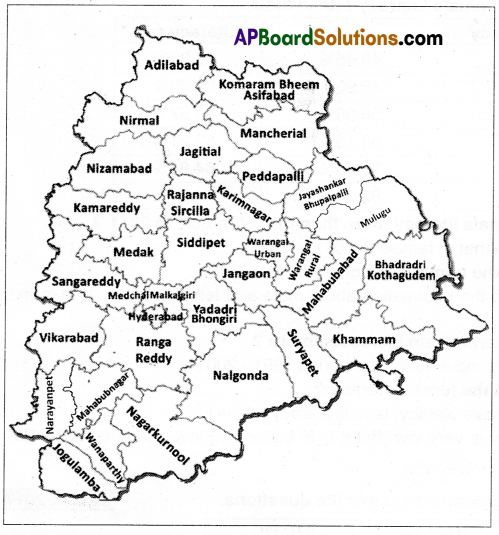
b. On a blank map of Telangana showing district boundaries, plot the population distribution using the dot method (one dot is equivalent to 10,000 population).
Answer:
- Adilabad – 708,972 =[71]
- Bhadradri – 1,069,261=[107]
- Hyderabad – 3,943,323=[394]
- Jagtial – 985,417 =[98]
- Jangaon – 566,376 =[56]
- Jayashankar – 711,434 =[71]
- Jogulamba – 609,990 =[61]
- Kamareddy – 972,625 =[92]
- Karimnagar – 1,005,711= [1001
- Khammam – 1,401 ,639= [140]
- Komaram Bheem – 515,812 =[51]
- Mahaboobabad – 77,549 =[77]
- Mahaboobnagar – 1,486,777=[148]
- Mancherial – 807,037 =[81]
- Medak – 767,428 =[77]
- Medchal – 2,440,073=[244]
- Nagarkurnool – 861,776 = [86]
- Nalgonda – 1,618,419=[162]
- Nirmal – 709,418 =[71]
- Nizamabad – 1,571,022=[157]
- Peddapalli – 795,332 = [79]
- Rajanna Sircilla – 552,037 =[55]
- Ranga Reddy – 2,446,265= [244]
- Sangareddy – 1,527,628=[153]
- Siddipet – 1,012,065=[101]
- Suryapet – 1,009,560=[110]
- Vikarabad – 927,140 =[93]
- Wanaparthy – 577,758 =[58]
- Warangal Rural – 718,537 =[72]
- Warangal Urban – 1,080,858=[108]
- Yadadri – 739,448 =[74]
- Narayanpet – 560,874 = [56]
- Mulugu – 294,671 = [29]
Project
Question 1.
Look at the following map of population density. Use the various aspects of population you are studying in this chapter and describe this region.
Answer:
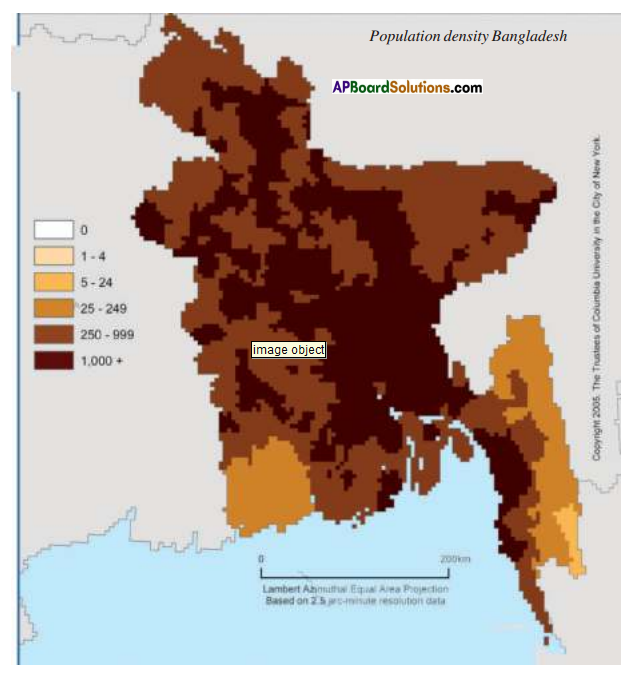
1. The population density is high in India when compared to Bangladesh.
2. The population distribution is more or less equal in all the regions in India.
3. As the forests decrease population increases.
![]()
TS 10th Class Social 6th Lesson The Population Intext Questions
Page No. 72
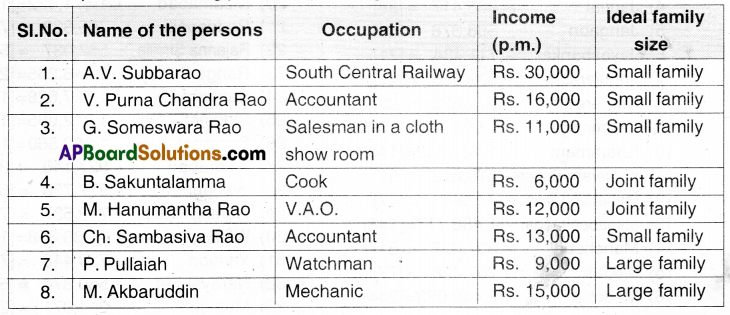
Question 1.
Talk to a few people in your neighborhood who have different occupations and incomes. Find out about their views on the ideal family size.
Answer:
Question 2.
Have you ever wondered how information about the people living in your locality or village, and the country as a whole is collected and recorded? Ask your teacher to explain their experiences of collection census data.
Answer:
To collect census information, areas of the country are divided into enumeration districts. A census interviewer is assigned to each individual district. The interviewer es trained to fully understand each and every aspect of the census information needed. During the month before the census, the interviewer begins preliminary enumerations. The interviewer will visit each building in his or her assigned district and quickly and accurately
complete the census questionnaires.
Once the questionnaires have been completed, they are taken to a main census office to be checked and coded. The census information is then ready to be input into computers that can generate the required statistics.
Question 3.
What Is the difference in collecting Information using a census or a sample method? Discuss with a few examples.
Answer:
Census and sampling both serve the purpose of providing data and information about a population.
Sample method: Under this technique, some representative units or informants are selected from the universe. These selected units are called samples. Based upon the data collected from these samples, conclusions are drawn upon the whole universe. It is to be noted that if the size of the sample Is considerably large and the samples have been properly selected, various results obtained from the study of the sample units. also hold good for entire universe.
Census method: Under this technique, each and every item or unit constituting the universe is selected for data collection. In the Indian Census, which is conducted once in ten years, this technique is invariably followed.
![]()
Page No. 73 & 74
Question 4.
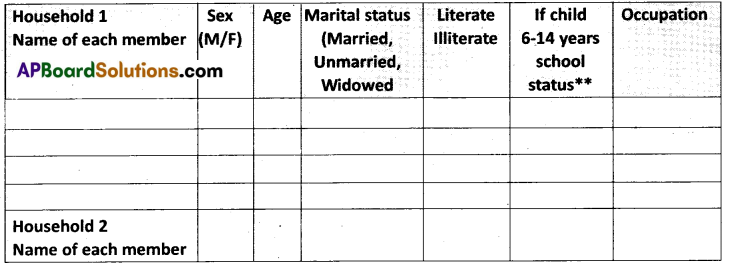
Conducting a Survey
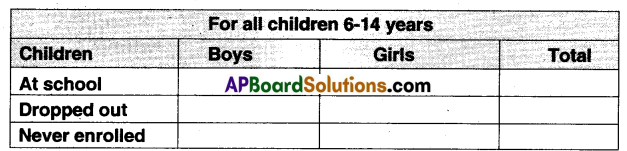
Each group of two to three students will collect data from lo families of their locality. The survey form is given below. Each group will fill in the details and construct the tables indicated. Based on the tables presented by each group, the class will discuss the questions.
Answer:
Self Activity
Before the survey
The classes needs to discuss and arrive at a common meaning for all the terms used in the survey form. Otherwise, there will be confusion in the actual survey and we would not be able to compare the result of one group with another With the help of your teacher discuss the following:
a) How would a household” be defined? Whom all would you include in a household?
Answer:
A household consists of one or more people who live in the same dwelling and also share meals or living accommodations. and may consist of a single tamely or some other grouping of people. I would not include any others.
b) For “Education’, what are the categories that you would use? Examples: child below six; studying in school/college, class….; should in school but not enrolled; studied up to class; did not attend school.
Answer:
1. School education -6 to 15 years of age
2. College education – 15 to 20 years of age
3. University education – 20’s to 25 years of age
4. Other education – 15 to 25 years of age
c) What categories would you use for occupation?
Examples: Homemaker, student, self-employed as unemployed, retired, non-employed, senior citizen.
Answer:
1) Homemaker
2) Student
3) Self-employed as,
4) Unemployed
5) Non-employed
6) Retired
7) Senior citizen. etc.
Page No. 74
Question 5.
After the Survey
Answer:
Each group would construct a table to show number of people In the surveyed families:
| Male | Female | Total Population |
Answer:
| Male | Female | Total Population |
| 330 | 315 | 645 |
B) What I. the female! male ratio for your group? Are the ratios very different among the groups? Discuss.
Answer:
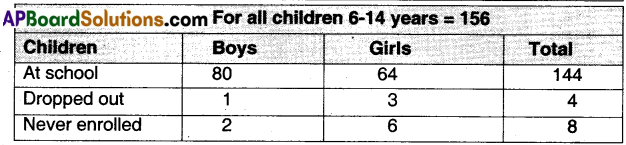
c) What Is the percentage of dropouts & never enrolled children as a whole- for all groups? What are the reasons for this?
Answer:
The percentage of dropouts never enrolled children as a whole = 8%
Reasons:
- Parents’ economical background,
- Their superstitions,
- Teaching styles and
- Subjects like English. Mathematics, etc.
D) For those above 20 years, what is the average time they have spent at school? Find this for your group. Is this data useful?
Answer:
They spent 5 1/2 hours per day at school.
This data is useful for the assessment of their school education.
E) For all the people In the age group 15-59
| Occupation | No. | % |
| Farmer | ||
| Casual Labour | ||
| Self-employed | ||
| Regular employee | ||
| Unemployed | ||
| Student | ||
| Total |
How do you classify those who are “working” and those who are “dependent” In your sample?
| Occupation | No. | % |
| Farmer | 60 | 20 |
| Causal Labour | 45 | 15 |
| Self-employed | 30 | 10 |
| Homemaker | 30 | 10 |
| Regular employee | 45 | 15 |
| Unemployed | 32 | 12 |
| Student | 58 | 18 |
| Total | 300 | 100 |
1) Homemakers, unemployed, and students are dependents.
2) Rest of the people are “working” as they are earning their livelihood.
![]()
Page No.75
Question 6.
Observe the following.
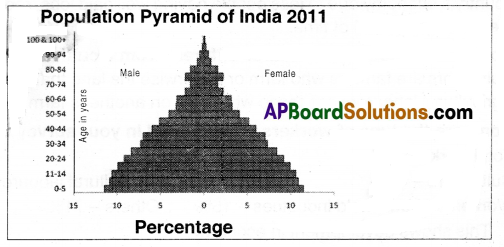
From the age pyramid given above, make a rough estimate of the percentage of children in the population.
Answer:
It is 31%. Male:190,075,426
Female:172,799,553
Question 7.
Based on your survey, present the following items In a table: Total Population, Children, Working, Aged. (Project Work)
Answer:
Self Activity.
Page No.77
Question 8.
Do girls get similar opportunities for further studies as boys?
Answer:
Yes, at present girls also get similar opportunities for further studies as boys.
Question 9.
Do married women have opportunities for travel and work outside home?
Answer:
Yes, many of the married women have opportunities for travel and work outside home.
Question 10.
Are women expected to maintain a separation from their natal family and not ask for security or property rights?
Answer:
Yes, women are expected to maintain a separation from their natal family. But they are expected to ask for security or property rights.
Question 11.
Do you think married women to be given freedom to visit their parent’s house?
Answer:
Yes. Married women should be given freedom to visit their parent’s house.
Question 12.
Is there a strong preference for boys In your region?
Answer:
No, there isn’t a strong preference for boys in our region. (OR) Yes, there is a strong preference for boys in our region. Even today in our region newly married couples strongly prefer to have male children.
![]()
Page No.78
Question 13.
Find out it there are illiterate people in your village or town. What does your survey reveal?
Answer:
There are 10 to 15 illïterates in our village. They are all above 70 years. Our survey reveals that they remained illiterate due to their family background and lack of knowledge.
Question 14.
Discuss: How does literacy impact development?
Answer:
Conclusion: Low literacy rates reduce development in a country because people who are educated are more able to become doctors and lawyers and set up businesses.
e.g.: II a country has a lower literacy rate, then it will have a negative impact on the country’s economy due to less people having well-paid jobs, reducing Its overall development for that period of time.
Question 15.
How is an agricultural labourer different from a cultivator?
Answer:
Cultivators are farmers who farm or supervise the land that they own or take on rent. Agricultural labourers are those who work on another’s farm for wages in cash or kind.
![]()
Question 16.
Compare the type of workers that you find in your survey with that of the Census.
Answer:
Total workers: 84
Cultivators – 4%
Agricultural labourers – 10%
Workers in household industries – 15%
Others -71 %
This shows development in economy.
Page No. 79
Question 17.
Observe the Increment in population of India and its growth – 1901-2011. :
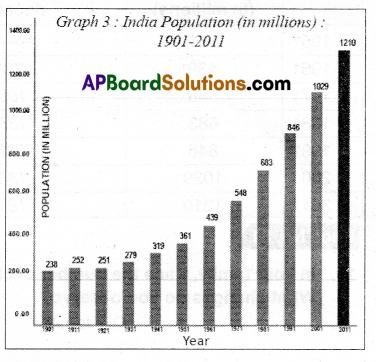
a) In which year did the population decrease?
Answer:
In 1921.
b) From which year onwards is the population continuously increasing?
Answer:
1931
c) What could be the reasons for the speed with which Increases took place alter Indian Independence?
Answer:
India has grown ciramancalty since achieving independence.
Reasons:
- Contact with western nations, in particular Great Britain, brought with it western medlone.
- The intant mortality rate dropped.
- The life expectancy rose.
- As the largest democratic nation in the world. India has been unable to torce population controls.
- High fertility rate due to early marriages.
- Some religious superstitions, etc.
Page No. 80
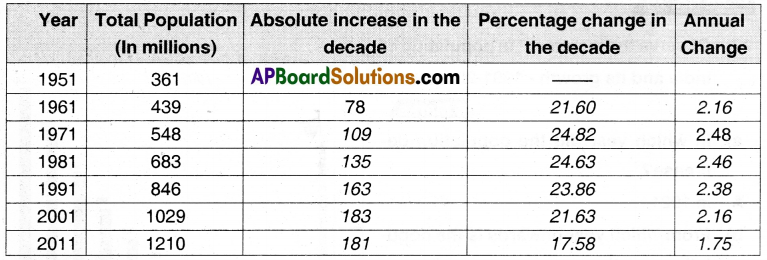
Question 18.
The Magnitude and Rate of India’s Population Growth (Calculate the missing figures and write them down.)
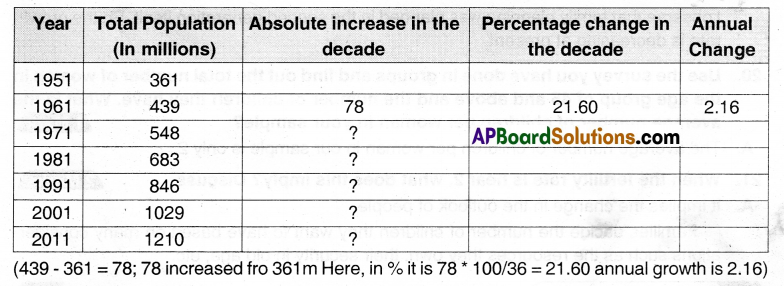
Answer:
Page No. 81
Question 19.
In your family, trace the number of children for every woman in three generations. What changes do you observe?
Answer:
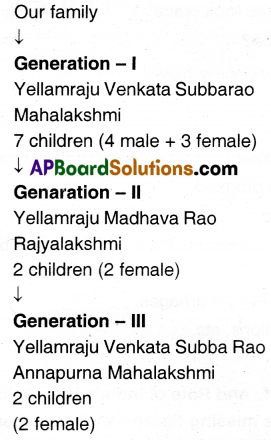
I observe that fanily planning was planned in the second generation itself. So the growth rate is decreasing at Present.
Question 20.
Use the survey you have done in groups and find out the total number of women In the age group of 45 and above and the number of children they have. What is the average number of children per woman In your sample?
Answer:
The average number of children per woman in our sample is only 2
Question 21.
When the fertility rate is near 2, what does this imply? Discuss.
Answer:
It implies the change in the outlook of people Familles decade the number of children they want to have based on many considerations such as the resources they own, their security in old age, etc.
![]()
Page No. 83
Question 22.
By which year was all the land in the village cultivated?
Answer:
By 1970 all the land in the Rampur village was cultivated.
Question 23.
How do you think did the landed people respond to Increasing family size?
Answer:
- The landed people can feed their children well.
- They can share the property up to the needs of their children. So I think landed people responded to increasing family size.
Question 24.
What was the response of small farmers, like Govind, when families expanded? How far was tube well irrigation useful?
Answer:
Small farmers like Govind should minimise their families. Otherwise, their lands with divided Into small holdings. Tubewell irrigation is useful upto some extent. The over usage of underground water leads to disaster.
Question 25.
Look at the following map. Find out if there is any relationship between relief features of India and population density. Identify the major urban centers across the country. How do you explain the high population density in the cities?
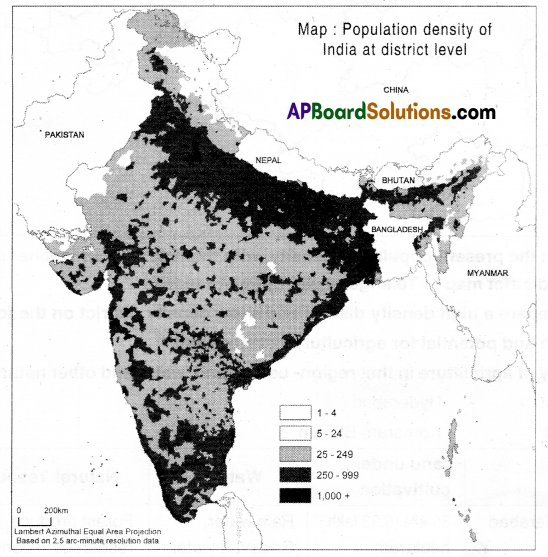
Answer:
Yes, there Is relationship between relief features of India and population density. The population density is high in the coastal plains and the Ganga Sullej plain. Arid It is also high on the river banks also. It is less in mountainous regions and In desert areas.
![]()
Page No.84
Question 26.
Observe the following map.
Collect the present population density, with the help of your teacher on the above blank district map of Telangana plot them in ranges.
Compare a high-density district and a low-density district on the following.
a. Terrain and potential for agriculture development
b. History of agriculture in that region- use of land, water, and other natural resources
Answer:
a. Highest – Hyderabad
Lowest – Komararn Bheern
b.
| Land under cuitlvation | Water | Natural resources | |
| Hyderabad | 35.4° (5.93 lakh hectares) | Rain water, Godavari water |
Forest produce, Mineral resources, Tourism, Fisheries. |
| Adilabad & Komaram Bheem | Almost all Nil | Man made and river water (Musi) | Forests and Sanctuaries |
Talangana – Density of Population
Rank District Density
1) Adilabad – 171
2) Bhadradri – 143
3) Hyderabad – 18172
4) Jagtial – 107
5) Jangaon – 259
6) Jayashankar – 115
7) Jogulamba – 208
8) Kamareddy – 266
9) Karimnagar – 473
10) Khammam – 321
11) Komaram Bheem – 106
12) Mahabubabad – 269
13) Mahabubnagar – 281
14) Mancherial – 201
15) Medak – 275
16) Medchal – 2251
17) Nagarkurnool – 124
18) Nalgonda – 227
19) Nirmal – 185
20) Nizamabad -366
21) Peddapalli – 356
22) Rajanna Sircilla – 273
23) Ranga Reddy – 486
24) Sangareddy – 347
25) Siddipet – 279
26) Suryapet – 305
27) Vikarabad – 274
28) Wanaparthy – 268
29) Warangal Rural – 330
30) Warangal Urban – 826
31) Yadadri – 239
32) Mulugu – 124
33) Narayanpet – 243