
SCERT AP Board 10th Class Social Solutions 6th Lesson The People Textbook Questions and Answers.
AP State Syllabus SSC 10th Class Social Studies Solutions 6th Lesson The People
10th Class Social Studies 6th Lesson The People Textbook Questions and Answers
Improve your learning
Question 1.
Identify the false statements and correct them :
a) Census data is collected every 10 years.
b) Sex ratio refers to the number of female in adult population.
c) Age structure shows us the distribution of people according to their age.
d) Population density is higher in mountains as people like the climate there.
Answer:
a) The statement is correct.
b) Sex ratio refers to the number of female per 1000 male.
c) The statement is correct.
d) Population density is lower in mountains due to hilly, dissected and rocky nature of the terrain, moderate to low rainfall, shallow and less fertile soils.
![]()
Question 2.
Based on the following table answer the questions below.
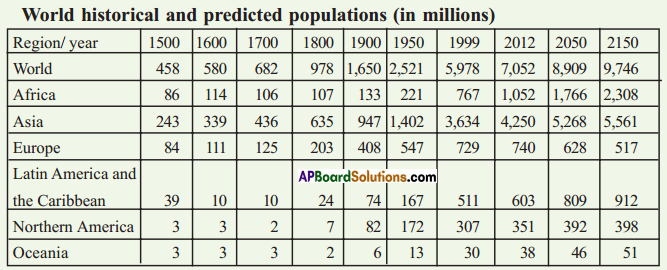 (a) Identify roughly how many centuries it took for the world population to double for the first time.
Answer:
300 years.
(b) In earlier classes you had studied about colonisation. Look at the table and identify in which of the continents the population decreased by 1800.
Answer: Oceania.
(c) Which continent has been most populous for most period of time?
Answer:
Asia.
(d) Is there any continent that is projected to show a significant decrease in population in future?
Answer:
Europe.
Question 3.
List out the impacts on society if sex ratio is too low or too high.
Answer:
- The unbalanced sex ratios should be reflected in various social settings, including the modern college campus.
- This ratio impacts the distribution of wealth, alter who sits in boardrooms and at the executive levels of the corporation and what governments do overtime.
- A high sex ratio can have many implications, including on crime.
- When there is a shortage of women in the marriage market the women can “marry up”, inevitably leaving the least desirable men with a marriage prospectus.
- Gender imbalance will lead to a reduction in birth rate.
(OR)
The variations of sex ratio shows serious impact on society.
If the sex ratio is high: (i.e., more women than men)
- Increase in women literacy – Better family management.
- Better financial management.
- Increases rural economy.
- Controls rural-urban migration.
- Increase in self-employment through self-help groups.
If sex ratio is low: (i.e., less women than men)
- Scarcity of women.
- It leads to illegal trafficking of women Ex: From Southern States to UP, Bihar etc.
- Unequal distribution of resources like health, nutrition, education etc.
![]()
Question 4.
Compare the Indian literacy rates with other countries:

What similarities and differences do you note?
Answer:
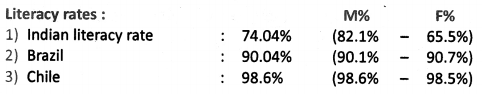
Similarities and differences:
- Almost all Asian countries have similar literacy rate except one or two i.e., low.
All the European countries have same literacy rate i.e., high. - The male literacy rate is high in all the countries except Brazil and Norway.
- The difference between male and female literacy rate is too high in India and Nepal.
- Only Norway has achieved 100% literacy rate.
Question 5.
Which areas of Andhra Pradesh have high density of population and what may be some of the
reasons behind it ?
Answer:
Some of the coastal districts especially in delta area and the districts around the capital city Amaravathi have high density of population.
The reasons behind it are :
- The regions in and around the delta areas have fertile soils.
- They have plenty of water facilities and favourable living conditions.
- The region around the capital city are developing industrially, and in all sectors.
![]()
Question 6.
Distinguish between population growth and population change.
| Population Growth | Population Change |
| 1) Population growth is the difference between birth rate and death rate plus migration. | 1) Population change is the number of people added to the total population in a year. |
| 2) It is expressed in percentage. | 2) It is expressed in the addition of number of people. |
| 3) Growth rate was 2.14% per year as per census 1991. It has declined to 1.93% per year in 2001. | 3) Population was 84.64 crore in 1991. It increased to 102.87 crore in 2001, and addition of 18.23 crore in a decade. |
Question 7.
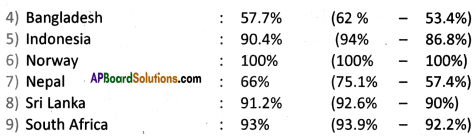
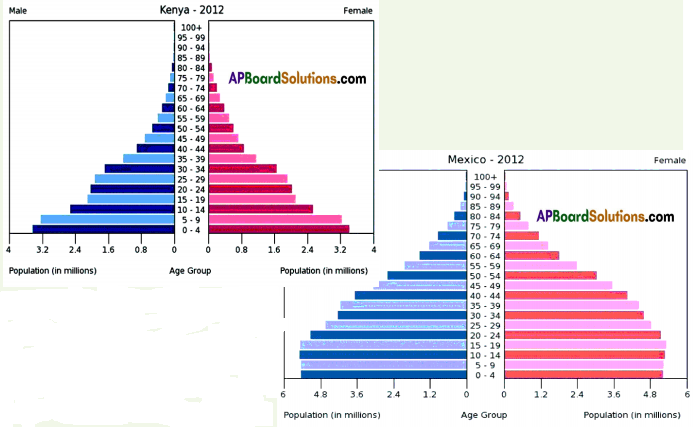
Compare the population pyramid of India with the data of three other countries given here.
 (a) Which country’s population is likely to grow ?
(b) Which country’s population is likely to reduce ?
(c) Compare the gender balance: What can you tell about each country’s family and welfare policies?
 Answer:
(a) India’s population is likely to grow.
(b) Sweden’s population is likely to reduce.
(c) Among the four countries Mexico has high sex ratio of 1041, Sweden follows with 1020 and Kenya with 1000, but India has a negative sex ratio – 940 females per 1000 males. As for family and welfare policies, they are well organized in Kenya.
![]()
Question 8.
Map work:
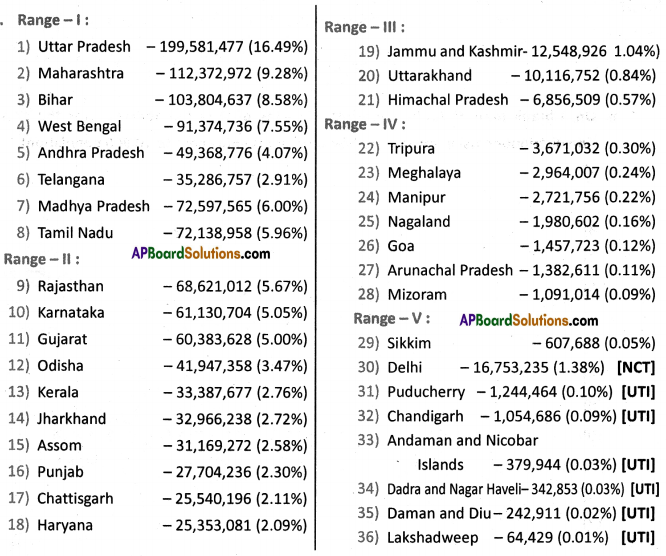
a. On a blank map of India showing state boundaries, plot the state-wise population density based on the 2011 census by taking five ranges.
Answer:
![]()
b. On a blank map of Andhra Pradesh showing district boundaries, plot the popula¬tion distribution using the dot method (one dot is equivalent to 10,000 population).
Answer:
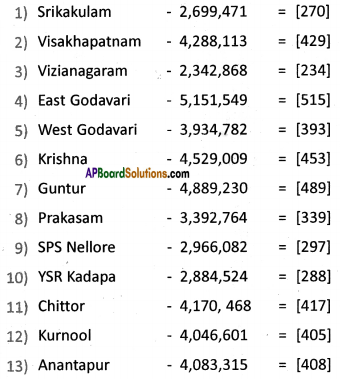

Note: Students are advised to do the map work using the dot method. The number of dots is mentioned in the brackets.
10th Class Social Studies 6th Lesson The People InText Questions and Answers
10th Class Social Textbook Page No. 71
![]()
Question 1.
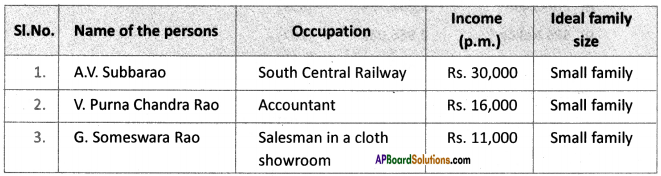
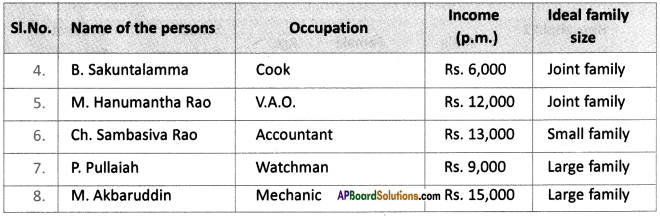
1. Talk to a few people in your neighborhood who have different occupations and incomes. Find out about their views on the ideal family size.
Answer:
I have opted for the following persons in our neighborhood.
Question 2.
Have you ever wondered how information about the people living in your locality or village, and the country as a whole is collected and recorded? Ask your teacher to explain their experiences of collecting census data.
Answer:
To collect census information, areas of the country are divided into enumeration districts. A census interviewer is assigned to each individual district. The interviewer is trained to fully understand each and every aspect of the census information needed. During the month before the census, the interviewer begins preliminary enumerations. The interviewer will visit each building in his or her assigned district and quickly and accurately complete the census questionnaires. Once the questionnaires have been completed, they are taken to a main census office to be checked and coded. The census information is then ready to be input into computers that can generate the required statistics.
![]()
Question 3.
What is the difference in collecting information using a census or a sample method? Discuss with few examples.
Answer:
Census and sampling both serve the purpose of providing data and information about a population.
Sample method: Under this technique, some representative units or informants are selected from the universe. These selected units are called samples. Based on the data collected from these samples, conclusions are drawn upon the whole universe.
It is to be noted that if the size of the sample is considerably large and the samples have been properly selected, various results obtained from the study of the sample units, also hold good for the entire universe.
Census method: Under this technique, each and every item or unit constituting the universe is selected for data collection.
In the Indian Census, which is conducted once in ten years, this technique is invariably followed.
10th Class Social Textbook Page No. 72 & 73
Question 4.
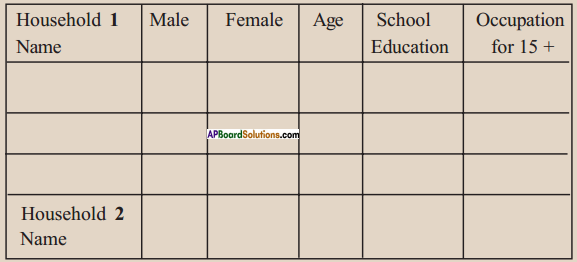
Conducting a Survey
- Each group of two to three students will collect data from 10 families of their locality. The survey form is given below.
- Each group will fill in the details and construct the tables indicated.
- Based on the tables presented by each group, the class will discuss the questions.
Answer:
Self Activity
![]()
Before the survey:
The class needs to discuss and arrive at a common meaning for all the terms used in the survey form. Otherwise, there will be confusion in the actual survey and we would not be able to com¬pare the result of one group with another. With the help of your teacher discuss the following:
- How would a “household” be defined? Whom all would you include?
Answer:
A household consists of one or more people who live in the same dwelling and also share meals or living accommodation and may consist of a single-family or some other grouping of people. I would not include any others. - For “Education” what are the categories that you would use?
Examples: child below six; studying in school/college, class….; should be in school but not enrolled; studied up to class ..; did not attend school.
Answer:- School education – 6 to 15 years of age
- College education – 15+ to 20 years of age
- University education – 20+ to 25 years of age
- Other education – 15+ to 25 years of age
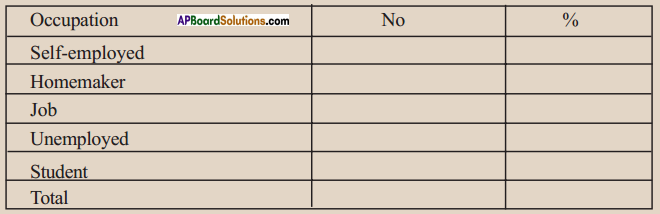
- What categories would you use for occupation?
Examples: Homemaker, student, self-employed as …, unemployed, retired, non-employed, senior citizen.- Home maker
- Student
- Employed
- Non-employed
- Retired
- Senior citizen etc.
After the Survey:
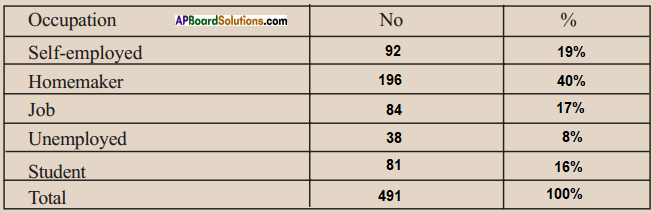
- Each group would construct a table to show a number of people in the surveyed families:
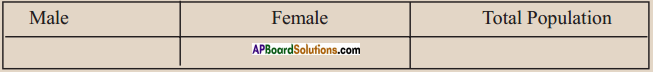
Answer:
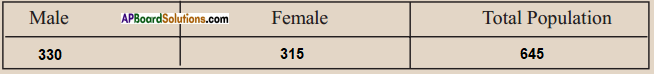
- What is the female/ male ratio for your group? Are the ratios very different among the groups? Discuss.
Answer:
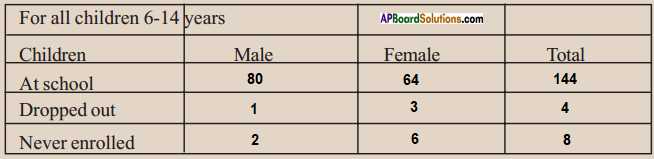
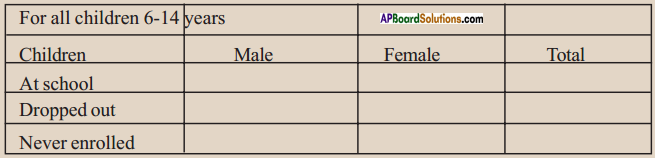
- What is the percentage of dropouts & never enrolled children as a whole-for all groups? What are the reasons for this?
Answer:
The percentage of dropouts never enrolled children as a whole = 8%
Reasons:- Parents’ economical background,
- Their superstitions,
- Teaching styles and
- Subjects like English, Mathematics etc.
- For those above 20 years, what is the average time they have spent at school? Find this for your group. Is this data useful?
Answer:
They spent 5\(\frac { 1 }{ 2 } \) hours per day at school.
This data is useful for the assessment of their school education. - For all people in the age group 15-59
How do you classify those who are “working” and those who are “dependent” in your sample?
Answer:
10th Class Social Textbook Page No. 74
![]()
Question 5.
Observe the following.
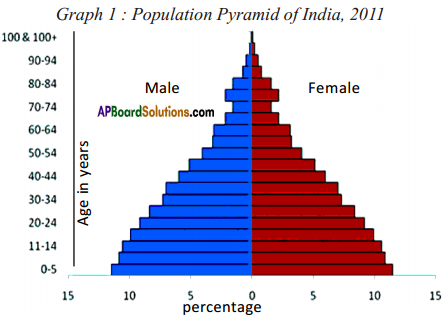 (a) From the age pyramid given above, identify a rough estimate of the percentage of children in the population.
Answer:
It is 31%.
Male : 190, 075, 426;
Female : 172, 799, 553
(b) Based on your survey present the following items in a table: Population, Children, Working, Aged.
Answer:
Self Activity.
10th Class Social Textbook Page No. 76
![]()
Question 6.
Do girls get similar opportunities for further studies as boys?
Answer:
Yes, at present girls also get similar opportunities for further studies as boys.
Question 7.
Do married women have opportunities for travel and work outside the home?
Answer:
Yes, many of the married women have opportunities for travel and work outside the home.
Question 8.
Are women expected to maintain a separation from their natal family and not ask for security or property rights?
Answer:
Yes, women are expected to maintain a separation from their natal family. But they are expected to ask for security or property rights.
Question 9.
Is there a strong preference for boys in your region?
Answer:
Yes, there is a preference for boys in our region, but it is not strong.
10th Class Social Textbook Page No. 77
![]()
Question 10.
Find out if there are illiterate people in your village or town. What does your survey reveal?
Answer:
There are 10 to 15 illiterates in our village. They are all over 70 years.
Our survey reveals that they remained illiterate due to their family background and lack of knowledge.
Question 11.
Discuss: How does literacy impact development?
Answer:
Conclusion:
Low literacy rates reduce development in a country because people who are educated are more able to become doctors and lawyers and set up businesses.
e.g.: If a country has a lower literacy rate then it will have a negative impact on the country’s economy due to less people having well-paid jobs, reducing its overall development for that period of time.
Question 12.
How is an agriculture laborer different from a cultivator?
Answer:
- Cultivators are farmers who form or supervise the land that they own or take on rent.
- Agricultural laborers are those who work on another’s form for wages in cash or kind.
- Cultivator invests some capital and Agricultural laborer does not invest any capital.
- Cultivator bears the profit or loss but Agricultural laborer is not responsible for profit or loss.
- Cultivator avails credit facilities but Agricultural laborer does not get any credit facility.
Question 13.
Compare the type of workers that you find in your survey with that of the Census?
Answer:
Total workers: 84
Cultivators – 4%
Agricultural laborers – 10%
Workers in household industries – 15%
Others – 71%
This shows development in economy.
![]()
10th Class Social Textbook Page No. 78
Question 14.
Observe the increment in the population of India and its growth 1901-2011.
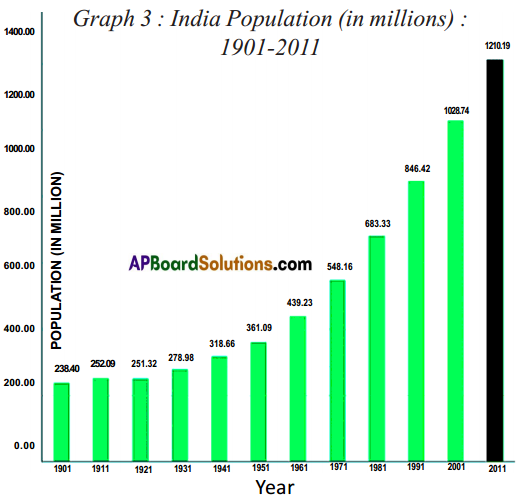
- In which year did the population decrease?
Answer:
In 1921. - From which year onwards is the population continuously increasing?
Answer:
1931 - What could be the reasons for the speed with which increases took place after Indian independence?
Answer:
India has grown dramatically since achieving independence.
Reasons:- Contact with western nations, in particular Great Britain, brought with it western medicine.
- The infant mortality rate dropped.
- The life expectancy rose.
- As the largest democratic nation in the world, India has been unable to force population controls.
- High fertility rate due to early marriages.
- Some religious superstitions, etc.
![]()
10th Class Social Textbook Page No. 79
Question 15.
Here are two posters from other countries. Can you guess the message given in them? Have you seen similar posters in India? Discuss.
 Answer:
Messages:
- A small family is an ideal family (2 children).
- It is difficult to maintain a big family i.e., with 6 or more children.
Conclusion:
Yes, I have seen similar posters in India also.
“We two, ours two”
![]()
![]()
10th Class Social Textbook Page No. 80
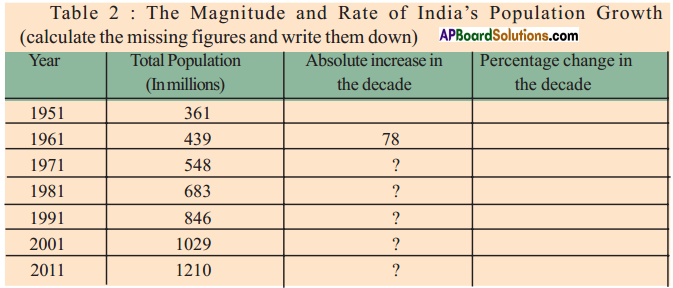
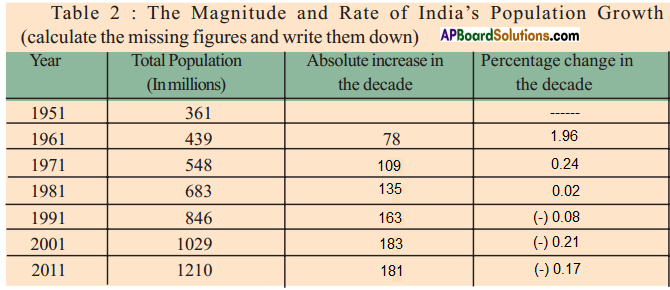
Question 16.
The Magnitude and Rate of India’s Population Growth (calculate the missing figures and write them down)
Answer:
10th Class Social Textbook Page No. 81
Question 17.
When the fertility rate is near 2, what does this imply? Discuss. (OR)
When the fertility rate is 2, what does it imply?
Answer:
It implies the change in the outlook of people.
Families decide the number of children they want to have based on many considerations such as the resources they own, their security in old age, etc.
![]()
Question 18.
Talk to some couples who are recently married but do not have children. How many children do they plan for? What are the reasons?
Answer:
- Couple — I: Pavan and Nagalakshmi Planned for two children.
- Couple — II: Bindu Madhavi and Ravi Kiran Planned for two children.
- Couple — III: Syamala Gayathri and Sharma Planned for two children
- Couple — IV: Achyuth and Sita Planned for one child.
Reasons:
- Their economic status.
- They want to provide best facilities to their children.
- They want to provide best education, etc.
Question 19.
In your family trace the number of children for every woman in three generations. What changes do you observe ?
Answer:
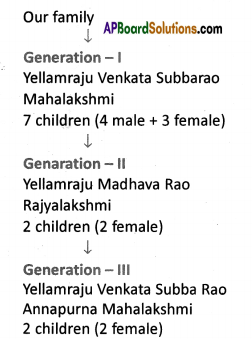 I observe that family planning was planned in the second generation itself. So the growth rate is decreasing at present.
Question 20.
Use the survey you have done in groups and find out total number of women in the age group 45 and above and number of their children. What is the average number of children per woman in your sample?
Answer:
The average number of children per woman in our sample is only 2.
![]()
Question 21.
What are the factors that influenced the decisions about children for Umed Singh? Do you think his daughter is thinking in a similar manner?
Answer:
Umed Singh wanted to have more living children, unlike his father. He believed in the saying ‘Puthrudu lenide Punnama Narakam Tappadu.’ He has a regular income and assets to feed up his large family.
These are the factors that influenced the decisions about children for Umed Singh.
I think his daughter is also thinking in a similar manner. So she planned for 3 children.
10th Class Social Textbook Page No. 82
Question 22.
By which year was all the land in the village cultivated?
Answer:
By 1970 all the land in the Rampur village was cultivated.
Question 23.
How do you think landed people responded to increasing family’s size ?
Answer:
1) The landed people can feed their children well.
2) They can share the property up to the needs of their children.
So I think landed people responded to increasing family size.
Question 24.
What was the response of small farmers, like Govind, when families expanded? How far was tubewell irrigation useful?
Answer:
Small farmers like Govind should minimize their families. Otherwise, their lands will be divided into small holdings.
The tubewell irrigation is useful up to some extent. The over usage of underground water leads to disaster.
![]()
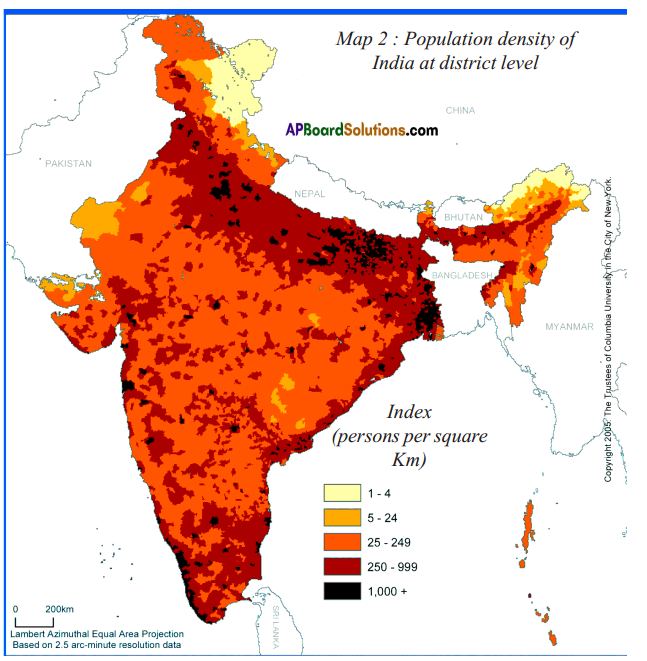
Question 25.
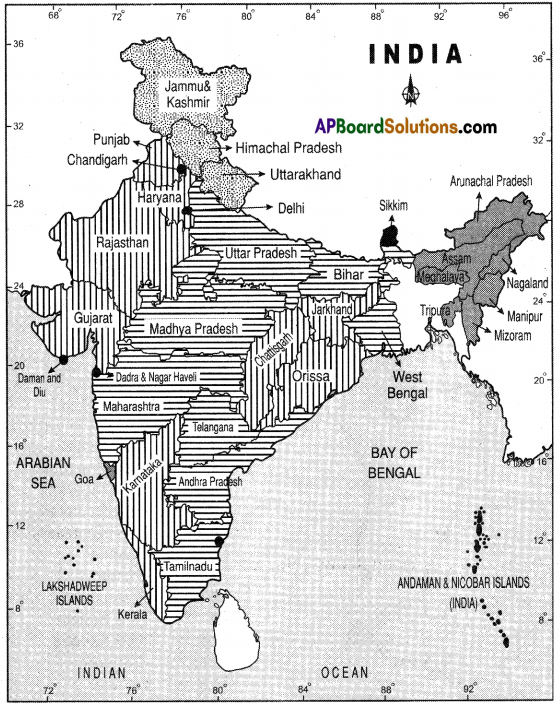
Look at the following map. Find out if there is any relationship between re¬lief features of India and population density. Identify major urban centers across the country. How do you ex¬plain the high population density in the cities?
 Answer:
Yes, there is a relationship between the relief features of India and population density. The population density is high in the coastal plains and the Ganga Sutlej plain. And it is also high on the river banks also. It is less in mountain¬ous regions and in desert areas.
10th Class Social Textbook Page No. 83
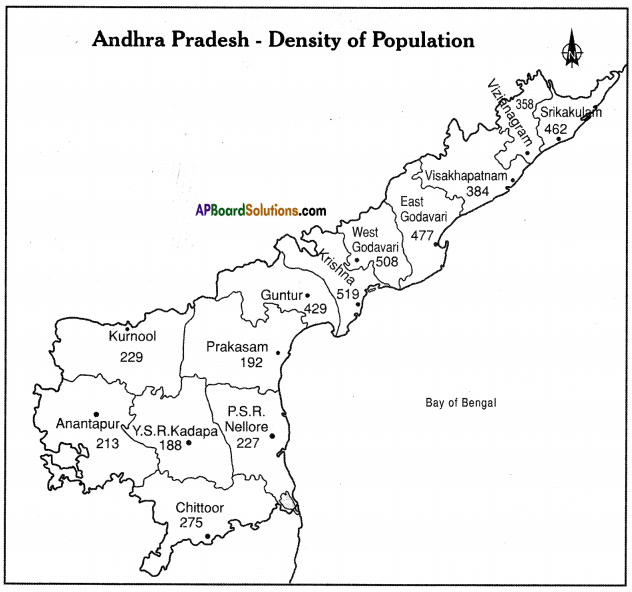
Question 26.
Observe the following map.
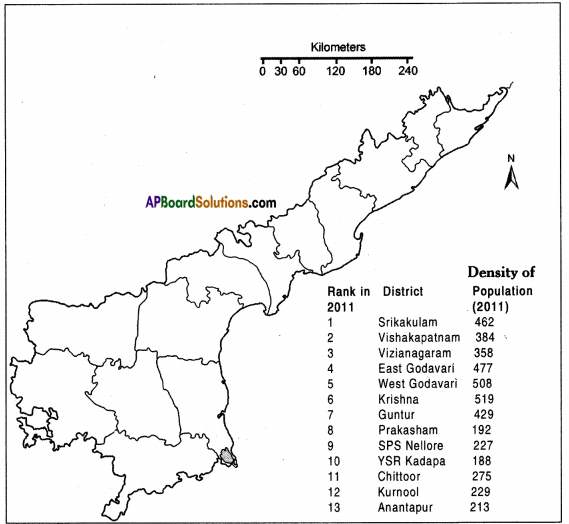 Here are the data for the population density of Andhra Pradesh – 2011. On the above blank district map of AP plot them in ranges.
Compare a high-density district and a low-density district on the following.
- Terrain and potential for agriculture development
- History of agriculture in that region- use of land, water and other natural resources
- Migration to or from that region and reasons for this
Answer:
- Highest – Krishna
Lowest – YSR Kadapa 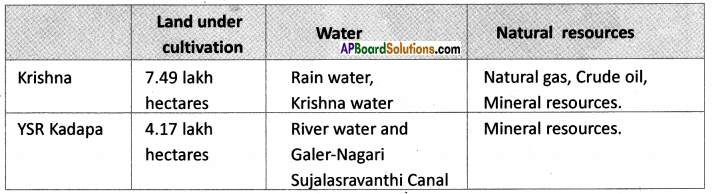
- 1) Migration to YSR Kadapa is almost NIL.
2) Migration from YSR Kadapa is due to education and employment.
3) Migration to and from Krishna district is mainly due to education and employment.
![]()
Project work
Look at the following two maps of density and the graphs on growth of population. Use various aspects of the population you studied in this chapter and describe them.
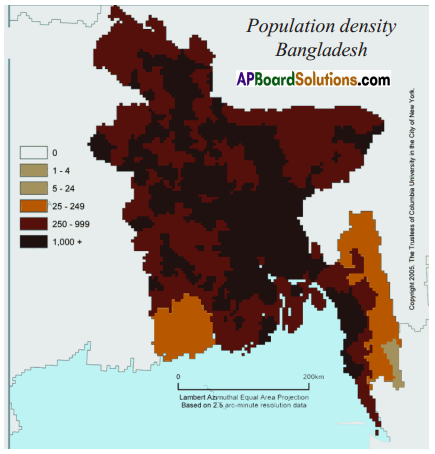
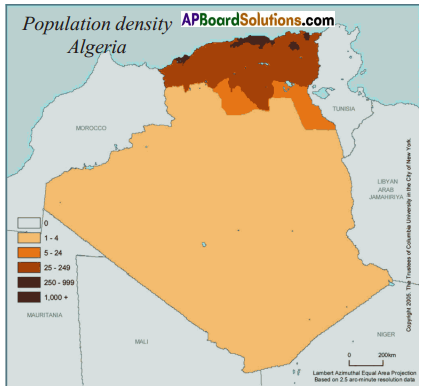
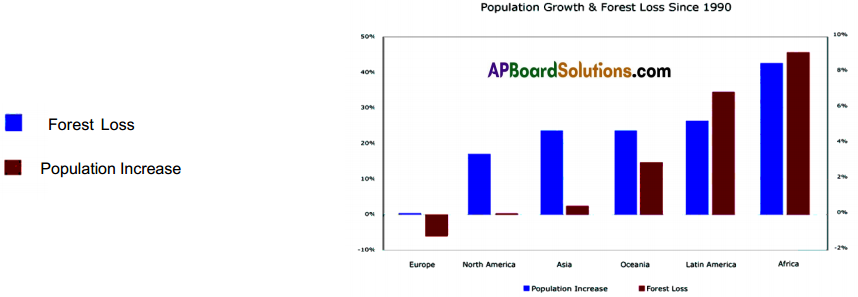
Answer:
- The population density is high in India when compared to Bangladesh.
- The population distribution is more or less equal in all the regions in India. But in Algeria population is concentrated along the Mediterranean Sea coastline as the country is over 80% desert.
- As the forests decrease population increases.