Students must practice these AP Inter 1st Year Economics Important Questions 10th Lesson Economic Statistics to boost their exam preparation.
AP Inter 1st Year Economics Important Questions 10th Lesson Economic Statistics
Question 1.
What is the relationship between Economics and Statistics? [March ’18, ’17]
(OR)
Explain the importance of Statistics. [May ’19 (AP)]
Answer:
Relationship between Economics and Statistics: There is a close relationship between Economics and Statistics.’Now we cannot imagine Economics without Statistics. Statistical data and tools are quite essential in the proper understanding of the economic problems and the formulation of the economic policies. Most of the economic problems always involve facts that can be expressed numerically such as Production, Consumption, Exchange, Distribution, Public finance, etc.
Apart from these, statistics is also useful to solve the problem of inflation, increase in population, poverty, unemployment and other burning issues of economics, commerce and business. Most of business laws and theories are based on statistical data. Besides the importance of statistics, it is also useful and has great significance in the field of Sociology, Psychology, Education, Astronomy, Medical science, Mathematics, Accountancy and Auditing, Banking and Insurance, War, etc. No analysis of an economic problem would be possible without data on various factors underlying an economic problem and no policies can be formulated to solve it.
Statistics provides statistical information to answer the three basic questions in Economics i.e., what to produce, how to produce and for whom to produce. Statistics helps to measure national income and its components like income, savings, investments, expenditures. Specially statistics helps to frame economic planning models like V hardships of poverty, unemployment, low productivity of people and backward technology. This concludes basic relationship between Economics and Statistics.
![]()
Question 2.
Explain the Geometric diagrams. What are Bar diagrams and Pie diagrams?
Answer:
Diagrammatic presentation of data: Diagrams may be less accurate but are much more effective than tables in presenting the data. There are three important kinds of diagrams in common use, they are
- Geometric diagram
- Frequency diagram
- Arithmetic line graphs.
Geometric diagram: These are mainly BAR DIAGRAM and PIE DIAGRAM.
Bar Diagram: Bar diagrams are of three types. There are
- Simple bar diagrams
- Multiple bar diagrams
- Component bar diagrams.
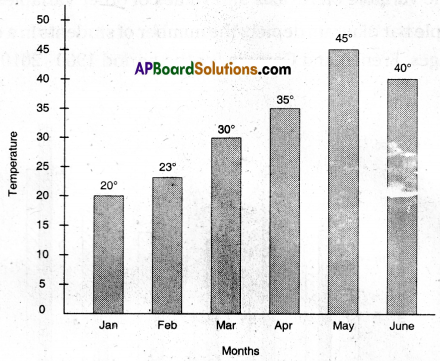
Simple bar diagram: Simple bar diagram is a one-dimensional diagram in which bar is constructed to represent one value of a given variable. The length of various bars is in the ratio of the magnitude of the given data. As the width of the bar is not significant, width is uniform for all bars. It is generally prepared when the data indicate different values of a variable over a time period or when the data represents different situations. Identical gap is left in between the different bars. The bar can be prepared either vertically or horizontally.
If the bars are prepared vertically, take the values of variable on Y – axis and time variable on X – axis.
E.g. 1: Maximum temperature in Hyderabad in the first six months in a year in bar diagram.
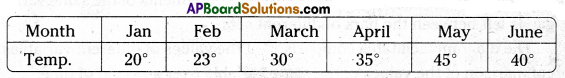
Let us take bars vertically. Take years on X – axis and population on Y – axis.
E.g. 2: Population of India between 1901 to 2011 in bar diagram.
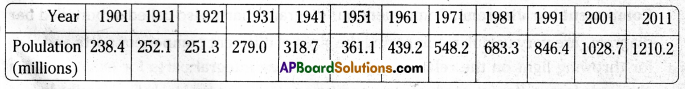
Let us take bars vertically. Take years on X – axis and population on Y – axis.

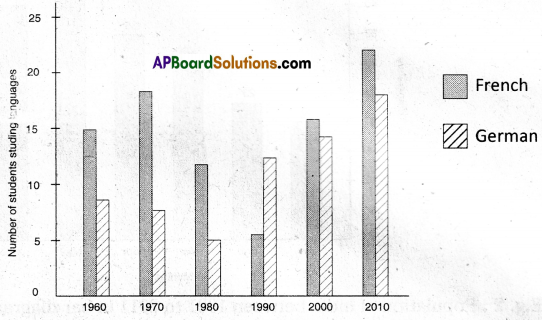
Multiple Bar Diagram: Multiple bar diagram is one dimensional diagram in which two or more bars adjoining each other are constructed to represent the values of the different variables or the values of various components of the same variable. An identical gap is left between the bars of different sets.
The diagram facilitates the comparison of the values of different variables in a set and the comparison of the values of the same variable over a period of time.
Take the time variable on X – axis and values of other variables on Y – axis.
E.g.: The multiple bar diagram depicts the number of students in a college studying two foreign languages, French and German for the period 1960 – 2010 is given below.
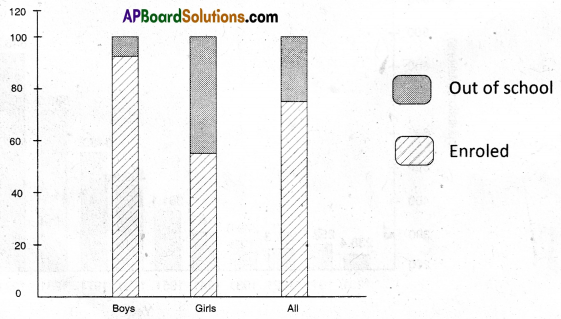
Component bar diagram: Component bar diagram charts also called subdivided bar diagram are very useful in comparing the sizes of different component parts and also for throwing light on the relationship among these integral parts for example sales proceeds from different products, and expenditure patterns in an atypical Indian family. In fact the values of the different components are cumulated for constructing this bar diagram and the bar is to be subdivided at these cumulated points.
E.g.: Enrolement at primary level in district of Bihar. Boys, girls and total children in the given age group are denoted in the component bar diagram given below:
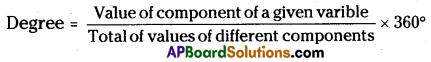
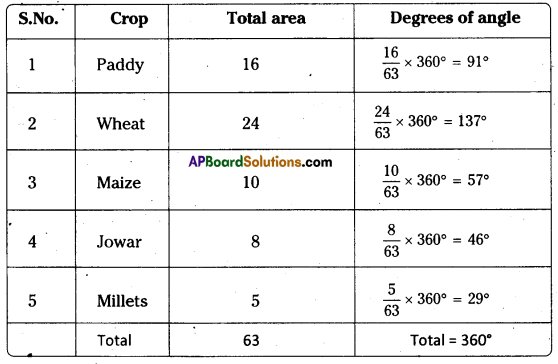
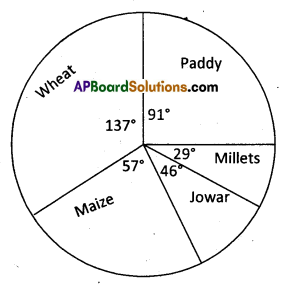
Pie diagram: Pie diagram is a circular diagram whose area is proportionately divided among the various components of a given variable. The circle is divided into as many parts as there are components by drawing straight lines from the centre to the circumference. Construct a circle and calculate the degrees of various components of a given variable as follows.
E.g. 1: Draw the Pie diagram for the given dta.
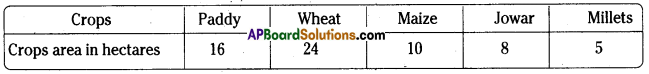
Total area = 16 + 24 + 10 + 8 + 5 = 63.
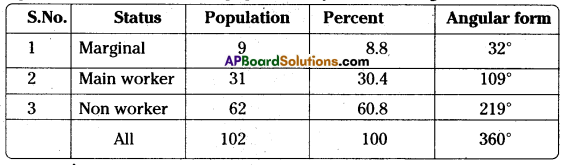
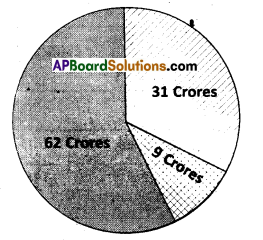
E.g. 2: Distribution of Indian population by their working status.
![]()
Question 3.
Calculate the A.M in direct method of the following data:
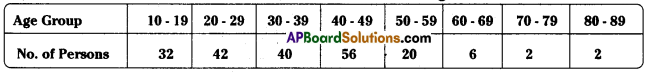
Answer:
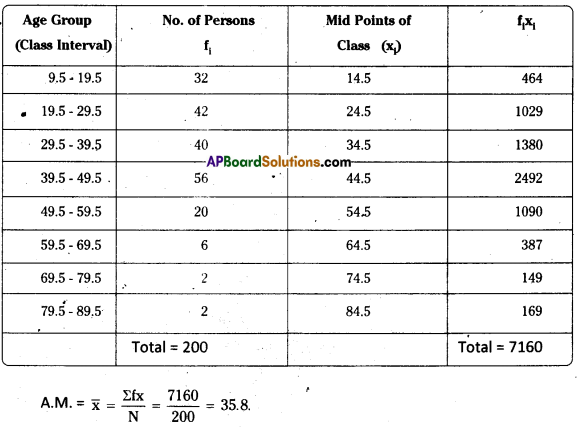
Question 4.
Calculate the A.M. in Direct Method.
Answer:
Question 5.
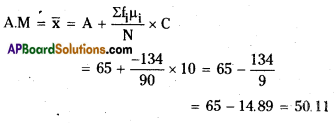
Calculate the A.M. in Deviation Method or Short Cut Method.
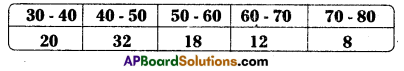
Answer:
A=65, C=10
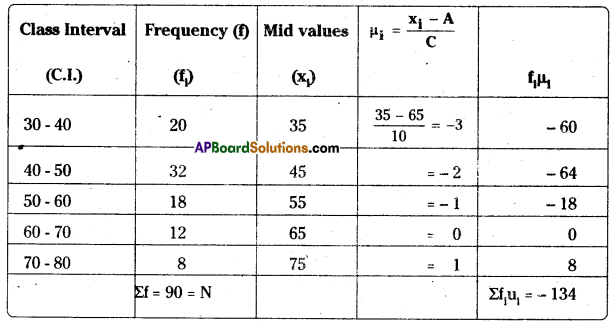
Here width of class C = 10; Assumed value A = 65
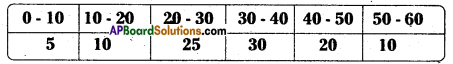
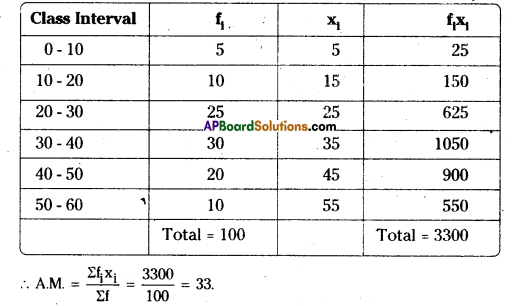
Question 6.
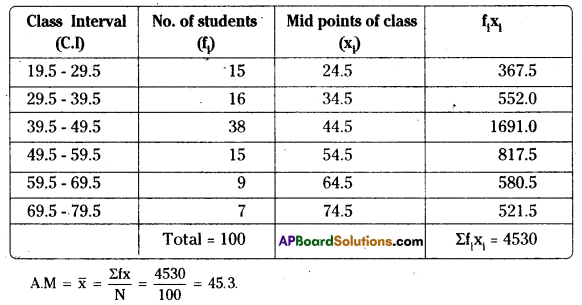
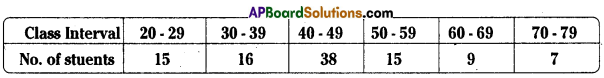
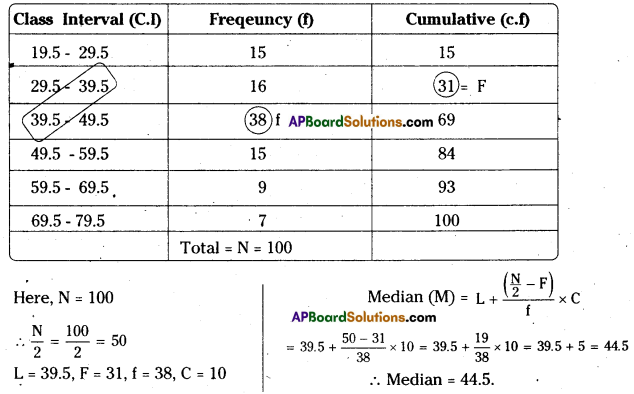
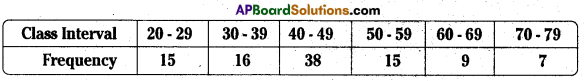
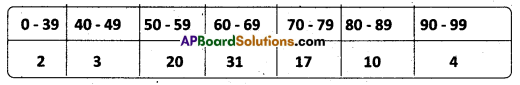
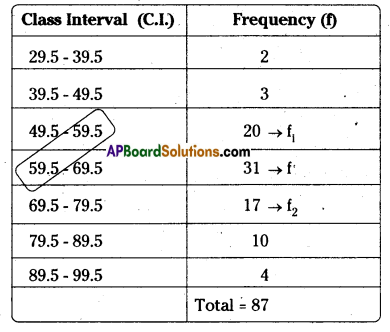
Calculate Mean, Median, Mode for the following data. [May 2018, 2016]
Note: The given distribution has unequal class intervals and it is an inclusive type of continuous frequency. We do not need to make all the class intervals equal but we have to change the given class intervals from inclusive to exclusive class intervals.
Answer:
Calculation of Mean:
Classification of Median:
Solution: We prepare the table to find the median.
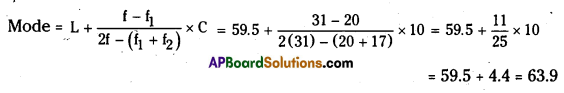
Calculation of Mode:
Solution:
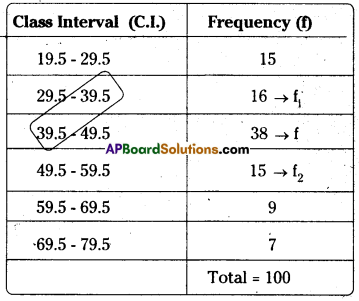
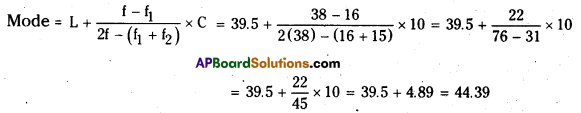
Here the maximum frequency occurs in 39.5 – 49.5 class,
f = 38, f1 = 16, f2 =15, L = 39.5, C = 10
![]()
Short Answer Questions
Question 1.
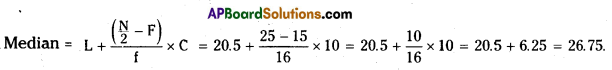
Calculate the Median for the following data.
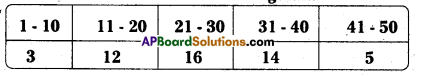
Answer:
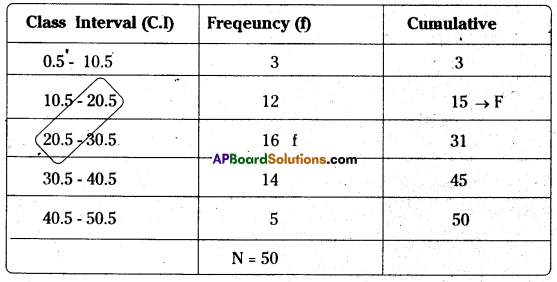
Here, N = 50
∴ N/2 = 50/2 = 25
L = 20.5, F = 15, C = 10, f = 16
Question 2.
Calculate the Median of die following data.
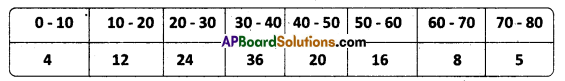
Answer:
We prepare the table to find the median.
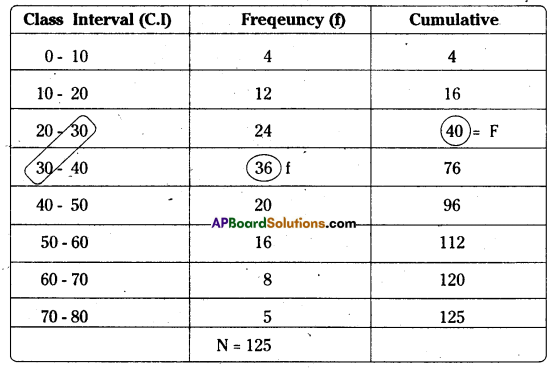
Here, N = 125
∴ N/2 = 125/2 = 62.5
L = 30, F = 40, C- 10, f = 36
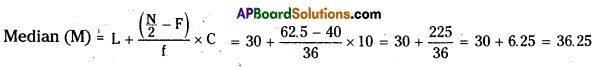
∴ Median = 36.25.
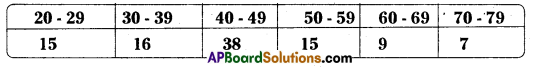
Question 3.
Calculate the Mode for the following data.
Answer:
Here the maximum frequency occurs in 39.5 – 49.5 class.
L = 59.5, f = 31, f1 = 16, f2 =15, C = 10
![]()
Very Short Answer Questions
Question 1.
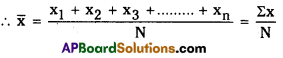
What is meant by Arithmetic Mean? [Mar. ’19 (AP); May 2018]
Answer:
Mean (ungrouped data): Mean is defined as the sum of the numbers divided by total number of observations. It is denoted by ![]()
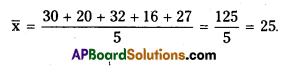
Question 2.
Find the A.M. for the data 30, 20, 32, 16, 27. [May, March 2017; May 2016] [May – 2018]
Answer:
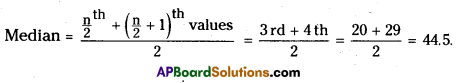
Question 3.
Find the Median for the data 10, 20, 15, 29, 35, 42.
Answer:
Arranging in ascending order is 10,15, 20, 29, 35, 42
Here, n = 6 (even)
Question 4.
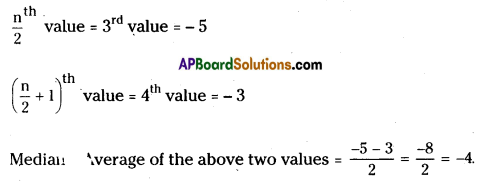
Find the value of Median for the data 19, 1, 3, 17, 6, 12, 11, 8.
Answer:
Arranging in ascending order is 1, 3, 6, 8,11, 12, 17, 19.
Here, n = 8

![]()
Question 5.
Find the Mode for the data 17, 6, 19, 14, 8, 6, 12, 15, 6, 16.
Answer:
In the given data 6 is occurring many times (3 times). Hence Mode is 6.
Question 6.
Find the Mode for the data 12, 11, 15, 11, 12, 12, 15, 12, 9, 12. [May 2017]
Answer:
In the given data 12 is occurring many times. Hence Mode is 12.
Question 7.
What is a Pie diagram ?
Answer:
Pie diagram: Pie diagram is a circular diagram whose area is proportionately divide among the various components of a given variable.
Question 8.
What is a Bar diagram ?
Answer:
Bar diagram is a diagram which consists of a group of equi-spaced and equi-width rectangular bars for each class or category of data.
Question 9.
Find the median of the observation – 3, – 5, – 8, 0, 2, – 10.
Answer:
Writing the data in ascending order, we have – 10, – 8, – 5, -3, 0, 2