AP State Syllabus AP Board 8th Class Maths Solutions Chapter 7 Frequency Distribution Tables and Graphs Ex 7.2 Textbook Questions and Answers.
AP State Syllabus 8th Class Maths Solutions 7th Lesson Frequency Distribution Tables and Graphs Exercise 7.2
![]()
Question 1.
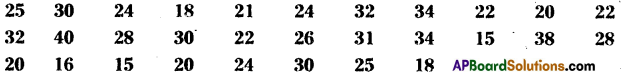
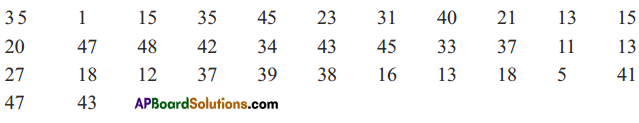
Given below are the ages of 45 people in a colony.
Construct grouped frequency distribution for the given data with 6 class intervals.
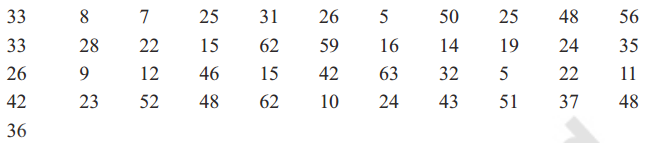
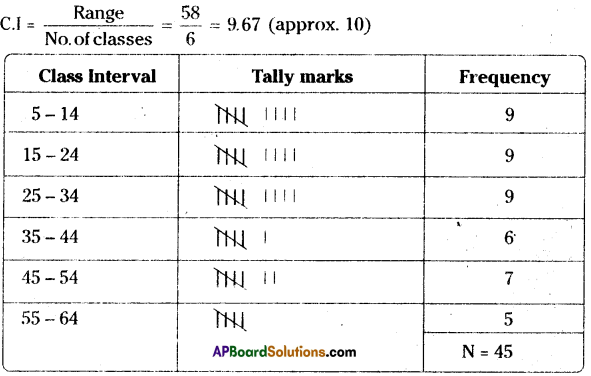
Solution:
Number of classes = 6
Range = Maximum value – Minimum value = 63 – 5 = 58
Question 2.
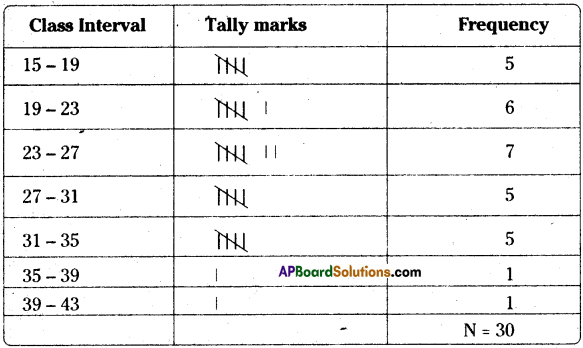
Number of students in 30 class rooms in a school are given below. Construct a frequency
distribution table for the data with a exclusive class interval of 4 (students).
Solution:
Class Interval (C.I.) = 4
Range = Maximum value – Minimum value = 40 – 15 = 25
No. of classes = \(\frac{\text { Range }}{\mathrm{C} . \mathrm{I}}=\frac{25}{4}\) = 6.25 *(approx ‘6’)
![]()
Question 3.
Class intervals in a grouped frequency distribution are given as 4 – 11, 12 – 19, 20 – 27, 28 – 35, 36 – 43. Write the next two class intervals. (1) What is the length of each class
interval? (ii) Write the class boundaries of all classes, (iii) What are the class marks of
each class?
Solution:
The given class intervals are 4-11,12 -19, 20 – 27, 28 – 35, 36 – 43
The next two class intervals are 44 – 51, 52 – 59
i) The length of each class interval is 8
ii) Boundaries of classes :
iii) Class = \(\frac{3.5+11.5}{2}=\frac{15}{2}\) = 7.5
| Class Interval | Boundaries of classes | Class Marks |
| 4-11 | 3.5-11.5 | 7.5 |
| 12-19 | 11.5-19.5 | 15.5 |
| 20- 27 | 19.5- 27.5 | 23.5 |
| 28-35 | 27.5-35.5 | 31.5 |
| 36-43 | 35.5-43.5 | 39.5 |
| 44-51 | 43.5-51.5 | 47.5 |
| 52-59 | 51.5-59.5 | 55.5 |
Question 4.
In the following grouped frequency distribution table class marks are given.
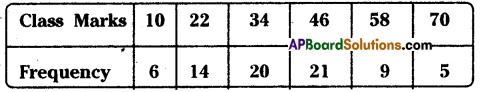
(i) Construct class intervals of the data. (Exclusive class intervals)
(ii) Construct less than cumulative frequencies and
(iii) Construct greater than cumulative frequencies.
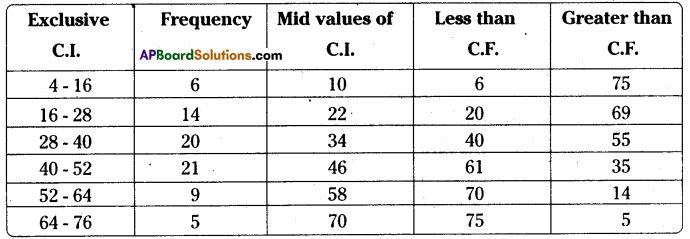
Solution:
To determine the lower boundary of first class :
The difference between two marks of consecutive classes = h = 22-10 = 12
Let the marks of each class be ‘x’ then the boundaries of the classes be
Lower boundary of first class = x – \(\frac{\mathrm{h}}{2}\) = 10 – \(\frac{12}{2}\) = 10 – 6 = 4
Upper boundary = 10 + \(\frac{12}{2}\) = 10 + 6 = 16
We can determine the remaining classes in the same way.
Question 5.
The marks obtained by 35 students in a test in statistics (out of 50) are as below.
Construct a frequency distribution table with equal class intervals, one of them being 10-20(20 is not included).
Solution:
The frequency distribution table is
| Class Interval | Frequency |
| 0-10 | 2 |
| 10-20 | 10 |
| 20-30 | 4 |
| 30-40 | 9 |
| 40-50 | 10 |
C.I. = 10 (from 10 – 20)
Range = 48 – 1 = 47
No. of classes = = 4.7 = 5 (approx)
![]()
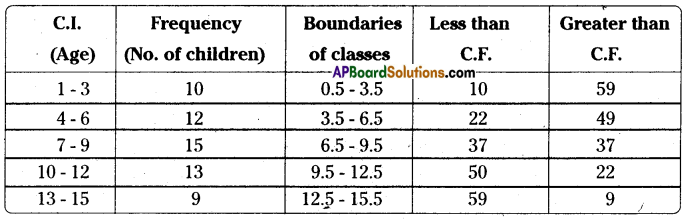
Question 6.
Construct the class boundaries of the following frequency distribution table. Also construct less than cumulative and greater than cumulative frequency tables.
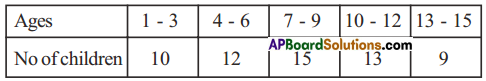
Solution:
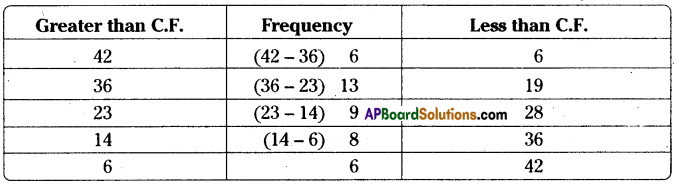
Question 7.
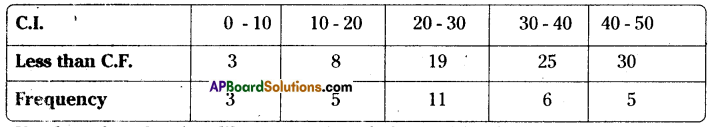
Cumulative frequency table is given below. Which type of cumulative frequency is given. Try to build the frequencies of respective class intervals.
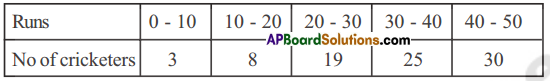
Solution:
In the given table frequencies are increasing from top to bottom. So, it is less than cumulative frequency distribution
| Less than C.F. | Frequency |
| 3 | 3 |
| 8 | (8 – 3) 5 |
| 19 | (19 – 8) 11 |
| 25 | (25 – 19)6 |
| 30 | (30 – 25) 5 |
∴ Thee required less than C.F. distribution table is
Question 8.
Number of readers in a library are given below. Write the frequency of respective classes.
Also write the less than cumulative fequency table.
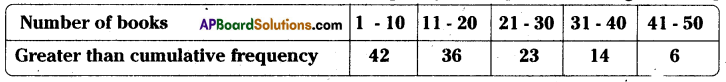
Solution: