AP State Syllabus AP Board 6th Class Maths Solutions Chapter 12 Data Handling Ex 12.3 Textbook Questions and Answers.
AP State Syllabus 6th Class Maths Solutions 12th Lesson Data Handling Ex 12.3
![]()
Question 1.
The life spans of some animals are given below:
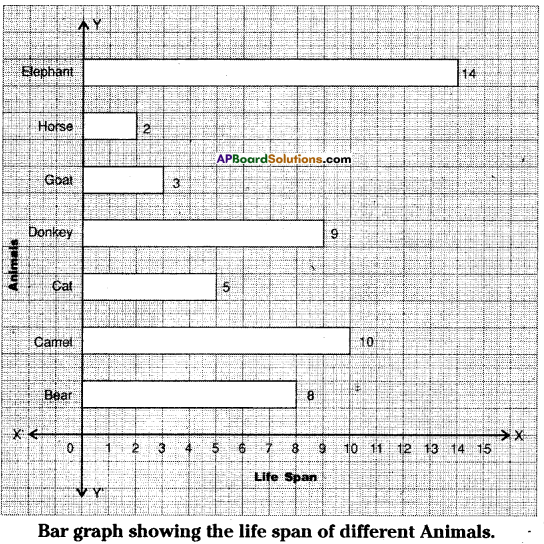
Bear – 40 years, Camel – 50 years, Cat – 25 years, Donkey – 45 years, Goat -15 years, Horse -10 years, Elephant – 70 years.
Draw a horizontal bar graph to represent the data.
Solution:

Steps of construction:
- Draw two mutually perpendicular lines on a graph sheet – one horizontal (X-axis) and one vertical (Y – axis).
- Mark name of the animal on the Y-axis and their life span (Number of years) on the X-axis.
- Take the GCD or HCF of given numbers as scale on the X-axis i.e., 1cm = 5 years.
- Calculate lengths or heights of the bars by dividing the life spans with the scale :
Bear = 40 ÷ 5 = 8 cm; Camel = 50 ÷ 5 = 10 cm
Cat = 25 ÷ 5 = 5 cm; Donkey = 45 ÷ 5 = 9 cm
Goat = 15 ÷ 5 = 3 cm; Horse = 10 ÷ 5 = 2 cm
Elephant = 70 ÷ 5 = 14 cm - Draw rectangular horizontal bars of same width (1cm) on the Y-axis with their calculated heights.
Hence, required horizontal bar graph was constructed.
![]()
Question 2.
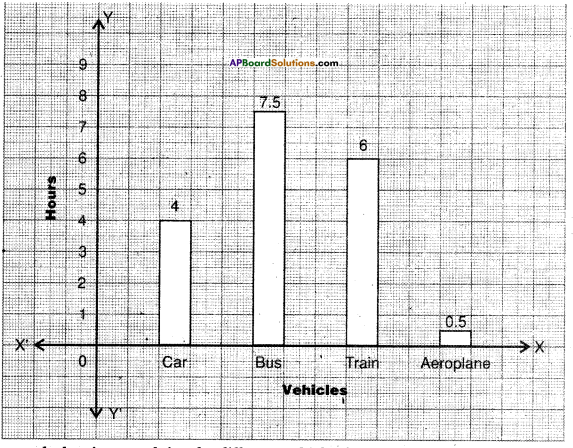
Travelling time from Hyderabad to Thirupathi by different means of transport are- Car – 8 hours, Bus – 15 hours, Train – 12 hours, Aeroplane – 1 hour. Represent the information using a bar diagram.
Solution:

Bar graph showing travel time by different vehicles from Hyderabad to Tirupathi.
Steps of construction :
- Draw two mutually perpendicular lines on a graph sheet – one horizontal (X-axis) and one vertical (Y-axis).
- Mark name of the vehicle on the X-axis and their travelling time (Number of hours) on the Y-axis.
- Take the 2 as scale on the Y-axis i.e., 1 cm = 2 hours.
- Calculate lengths or heights of the bars by dividing the travelling time with the scale.
Car = 8 ÷ 2 = 4 cm
Bus = 15 ÷ 2 = 7.5 cm
Train = 12 ÷ 2 = 6 cm
Aeroplane = 1 ÷ 2 = 0.5 cm - Draw rectangular vertical bars of same width (1cm) on the X-axis, with their calculated heights.
Hence, required vertical bar graph was constructed.
![]()
Question 3.
A survey of 120 school students was conducted to find which activity they prefer to do in their free time.

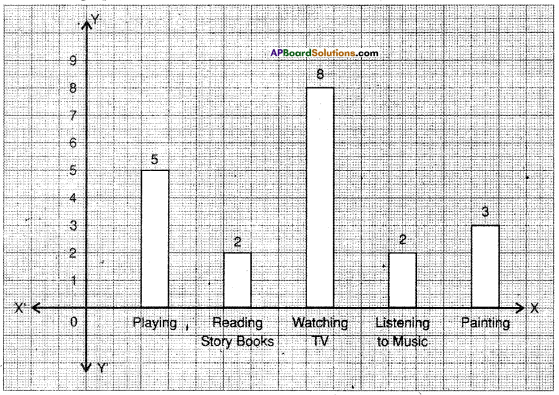
Draw a bar graph to illustrate the above data.
Solution:

Bar graph showing the students can prefer to do Activities in free time.
![]()
Steps of construction :
- Draw two mutually perpendicular lines on a graph sheet – one horizontal (X-axis) and one vertical (Y-axis).
- Mark name of the activity on the X-axis and the number of students on the Y-axis.
- Take the 5 as scale on the Y-axis i.e., 1cm = 5 students.
- Calculate length or heights of the bars by dividing the number of students-with the scale.
Playing = 25 ÷ 5 = 5 cm
Reading story books = 10 ÷ 5 = 2 cm
Watching TV = 40 ÷ 5 = 8 cm
Listening to music = 10 ÷ 5 = 2 cm
Painting = 15 ÷ 5 = 3 cm - Draw rectangular vertical bars of same width (1cm) on the X-axis with their calculated heights.
Hence, required vertical bar graph was constructed.
